How to run A/B tests on assortment and layout in Universities & campus retail autonomous stores.

When you run a/b tests in campus autonomous stores, you compare different product assortments or layout setups to find out which option performs better. You set clear goals before starting any a/b testing. You measure conversion rates to see what works best. You rely on data from each test to guide your choices. Testing one change at a time gives you results you can trust and helps you make decisions that improve your store.
Key Takeaways
Start every A/B test with clear goals. Define what you want to measure, like sales or user experience.
Test one change at a time. This helps you understand which specific change impacts customer behavior.
Collect and analyze data carefully. Use reliable tools to track user interactions and measure results accurately.
Share your findings with your team. This fosters a culture of learning and continuous improvement in your store.
Avoid biases in testing. Ensure your test and control groups are similar to get reliable results.
A/B Testing Basics in Campus Retail
What Is A/B Testing?
You use a/b testing to compare two versions of something to see which one works better. In campus retail, you might test two different product assortments or layouts. You show one version to one group of users and another version to a different group. This process is also called split testing. You collect data from both groups and look at the results. You want to see which version leads to more sales or a better user experience. A/b testing helps you make decisions based on facts, not guesses. You can use a/b tests for website optimization, page content and layout, or even in physical stores.
Why Test Assortment and Layout?
You test assortment and layout because small changes can affect customer behavior. When you change where you place snacks or drinks, you might see more people buy them. You can also test which products to offer. A/b testing lets you see what your users like best. You get data that shows you what works. You use these insights to improve your store. Testing one thing at a time gives you clear results. You can see exactly what change made a difference. This helps with optimization and makes your store better for every customer.
Tip: Always set clear goals before you start a/b testing. Decide what you want to measure, like sales or conversion rates.
Here is a table that shows why a/b testing matters in campus retail:
Evidence Type | Description |
|---|---|
A/B Testing | A/b testing allows for comparison of different store layouts or product assortments to determine what resonates best with customers. |
Goals and KPIs | Establishing clear goals and measurable KPIs is essential for guiding a/b tests and tracking success. |
Variable Testing | Testing one variable at a time ensures clarity on which changes affect customer behavior. |
Data Collection Tools | Utilizing reliable data collection tools is crucial for analyzing results and ensuring statistical significance. |
Continuous Improvement | Sharing a/b testing results fosters a culture of continuous improvement and learning within the team. |
Unique Aspects of Campus Autonomous Stores
Campus autonomous stores have special features. You do not need cashiers. Users check out by themselves. You often serve students, staff, and prospective visitors. These users want a fast and easy experience. You must pay attention to how they move through the store. Data from a/b testing helps you see what works for this group. You can test new technology, assortment, or layout. You use the results to make the store better for everyone. A data-driven approach helps you keep improving and meet the needs of universities.
Setting Up A/B Tests
Defining Goals and Hypotheses
You need to start every a/b test with a clear goal. This helps you know what you want to learn. You should write down your hypothesis before you begin. A hypothesis is a guess about what will happen when you change something in your store. For example, you might think that moving healthy snacks to the front will increase sales. You want your goals to be specific and measurable. This makes it easier to see if your test worked.
Here is a simple way to set up your a/b testing plan:
Define clear objectives. Decide what you want to improve, like sales, conversion rates, or user experience.
Choose one variable to test. This could be a product assortment or a layout change.
Create your control and test variations. Change only one thing between them.
Figure out how many users you need for your test. Make sure your test runs long enough to get reliable results.
Plan to look at different user segments. You might want to see if students and staff react differently.
Set up tracking. Use your data tools to collect information during the test.
Tip: Changing only one variable at a time lets you know exactly what caused the results. This makes your insights more trustworthy and helps with optimization.
Choosing Test and Control Groups
You need to split your users into two groups for a/b testing. One group sees the current version (the control group). The other group sees the new version (the test group). Both groups should be about the same size. This keeps your results fair and accurate. You also need to decide how you will divide users. You can use user ID, device, or even time of day.
Here is a table to help you understand the difference:
Group Type | Description |
|---|---|
Control Group | Users who see recommendations from the existing rule-based system. |
Test Group | Users who see recommendations from the new ML-based system. |
Similar Size | The groups must be of similar size to ensure statistical validity. |
Subject: Pick what you will use to split users, like user ID or device.
Population: Choose who can be in your test, like students, staff, or prospective visitors.
You want your test and control groups to match as closely as possible. This helps you see the real effect of your change. If your groups are too different, your results might not show the true impact on customer behavior.
Designing Assortment and Layout Variations
You should focus on one change at a time in your a/b tests. This could be a new product assortment or a different layout. If you change more than one thing, you will not know which change caused the results. For example, you might test a new snack display near the entrance. You could also try offering a new drink in your assortment. Make sure you only test one of these at a time.
When you design your variations, think about what matters most to your users. You want to pick changes that could impact sales, revenue, or user experience. Use your data to choose what to test. Look for areas where you see low sales or where customers seem confused. You can use insights from past tests or website analytics to guide your choices.
Note: A data-driven approach helps you make better decisions. You can use the results from your a/b testing to improve your store and meet the needs of universities.
You should always document your tests. Write down what you changed, why you changed it, and what you expected to happen. This helps you learn from each test and share your findings with your team. Over time, you will build a library of what works best in campus retail stores.
Running and Measuring A/B Tests
Implementing Tests in Stores
You need to plan your a/b tests carefully before you start. Write down every detail about your test. Record what you change, why you change it, and what you expect to see. Good documentation helps you repeat successful tests and avoid mistakes in the future. You should also decide how long your test will run. Most a/b testing in campus retail stores should last no more than four weeks. Shorter tests help you keep your data accurate. If you run tests for too long, you might see problems like cookie expiration or changes in user behavior.
You must understand your target demographic. Students, staff, and prospective visitors all shop differently. You should design your a/b testing to include these groups. This helps you get results that reflect real customer behavior. You can use inclusive testing to see how changes affect underrepresented groups. For example, you might want to know how students with limited digital literacy respond to a new store layout.
Tip: Always match your test and control groups as closely as possible. This gives you reliable results and helps you see the true impact of your changes.
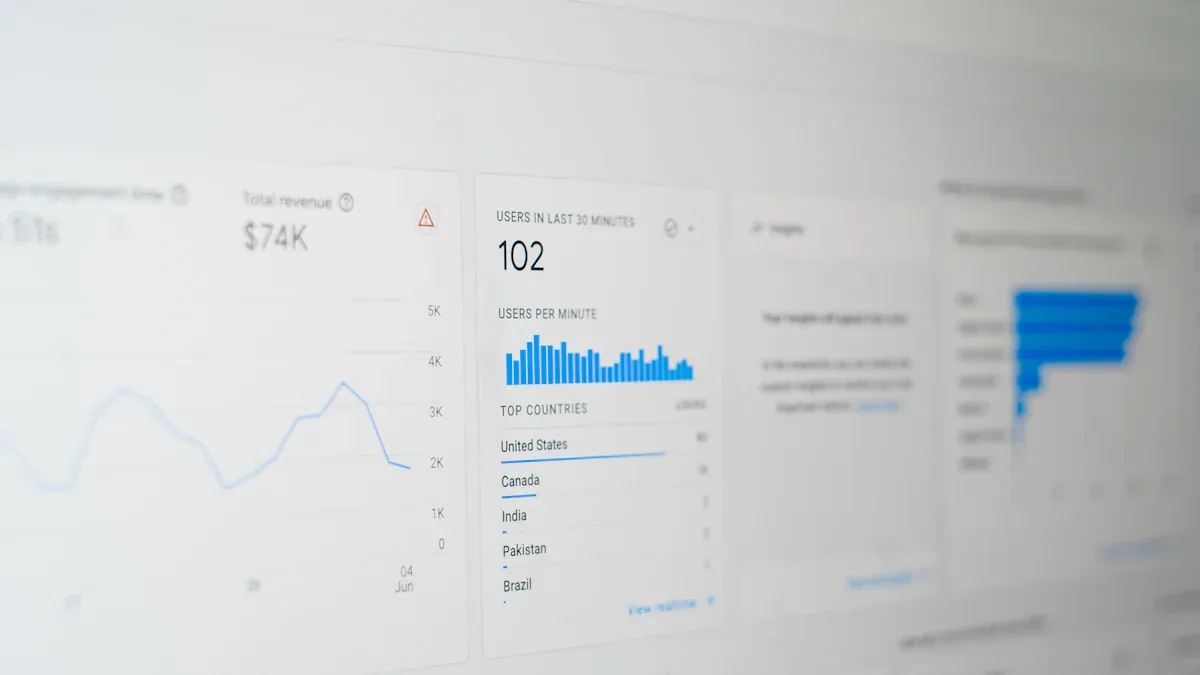
Collecting and Analyzing Data
You need to collect the right data to measure the impact of your a/b tests. Use tools that track how users move through your store. These tools can give you valuable customer insights. Here are some effective methods for collecting data during a/b testing:
Eye tracking helps you see where users look and what catches their attention. This method shows you how your assortment and layout influence decisions.
Logging shopping paths records how users walk through the store. You can use this data for optimization and to improve the store layout.
Mobile eye tracking works in real-life retail stores. It captures user behavior and helps you understand shopping habits.
After you collect your data, you need to analyze it. Look for patterns in how users interact with your assortment and layout. Use data analysis to find out what works best. You can compare results from your test and control groups. This process gives you data-backed insights for your next round of a/b testing.
Measuring Conversion and Sales Impact
You want to know if your changes improve sales, conversion rates, or user experience. Start by measuring conversion rates for both your test and control groups. Use a control group for comparison. Set a clear hypothesis before you begin. This helps you know what you are measuring.
You can use the Chi-Squared test to see if your results are significant. A p-value less than 0.025 means you have found a real difference between your groups. Here is a simple table to help you understand how to measure statistical significance:
Variant | Conversion Rate | p-value | Chi-Squared Statistic |
|---|---|---|---|
A | 0.30 | 0.14 | 2.16 |
B | 0.20 | N/A | N/A |
If you see a significant difference, you know your change made an impact. Use these results to guide your next steps. You can improve your assortment, layout, or even your website based on what you learn. This data-driven approach helps you increase revenue and create a better user experience for everyone in your store.
Note: Always use your results to make improvements. Share your findings with your team. This helps everyone learn and supports continuous optimization in universities and campus retail stores.
Best Practices and Pitfalls
Avoiding Bias in A/B Testing
You want your a/b testing to give you accurate results. Bias can make your tests less reliable. In campus retail, common sources of bias include survivorship bias and p-value misuse. Survivorship bias happens when you only look at successful outcomes and ignore the ones that did not work. This can lead you to believe a change is better than it really is. P-value misuse means you might think a result is true just because the p-value is low, but it only shows statistical significance. You should always check your data carefully and avoid jumping to conclusions.
Other mistakes include failing to control for variables, making decisions too soon, and not understanding what your customer values. You need to design your tests with care and focus on one change at a time, such as a new layout or assortment. This helps you see how each change affects customer behavior.
Survivorship bias
P-value misuse
Not controlling variables
Premature conclusions
Misunderstanding customer needs
Tip: Always review your test design and make sure you collect enough data before making decisions.
Ensuring Reliable Results
You can improve the reliability of your a/b tests by following a few key steps. Careful test design is important. Plan how many stores you need and how long the test should run. Understand the minimum detectable effect, which tells you the smallest change you can measure. Address biases by checking your metrics and increasing your data if needed.
Good documentation supports reliable results. You should keep records of every test. Use double-data entry to check for mistakes. Protect your data with passwords and secure file transfers. Write an evaluation design report to track all changes and outcomes.
Documentation Practice | Description |
|---|---|
Paper-based Questionnaires | Save during data entry for verification, then destroy after checking. |
Double-data Entry | Check responses against keypunched data for accuracy. |
Data Confidentiality | Use encryption and passwords to protect data. |
Secure File Transfer | Use SFTP and control who can access the data. |
Evaluation Design Report | Document all questions, outcomes, and design changes. |
Using Insights for Improvement
You can use insights from a/b tests to drive continuous improvement. Build a culture where your team learns from every test. Use tests to reduce risks before making big changes. Turn mistakes into lessons you can measure. Stay agile and focus on progress, not perfection.
Try using a simple cycle for optimization:
Plan: Set your goal, analyze data, and make a plan.
Do: Run the test, watch the results, and write down what happens.
Check: Review the results and get feedback.
Act: Make changes based on what you learned and get ready for the next test.
Note: Sharing results with your team helps everyone learn and improves your store for every customer.
You can improve your campus store by following a clear A/B testing process. Start with a goal, test one change, and keep detailed data records. Share your results with your team in a way that is easy to understand. Use tools like Google Analytics and a significance calculator to track data and measure results. Keep testing new ideas and use data to guide your decisions. Try resources such as an A/B Testing Guide or Evan’s Awesome A/B tools to support your work.
A/B Testing Guide
Landing Page Analyzer
Google Analytics
Significance Calculator
Evan’s Awesome A/B tools
ABtestbot
Duration Calculator
FAQ
How long should you run an A/B test in a campus store?
You should run your test for at least two weeks. This gives you enough data to see real patterns. Short tests may not show true results.
What tools can you use to track A/B test results?
You can use tools like Google Analytics, store sensors, or sales tracking software. These tools help you collect and review data easily.
Can you test more than one change at a time?
You should test only one change at a time. This helps you know exactly what caused the results. Testing many changes together can confuse your findings.
How do you know if your test results are reliable?
Check if your groups are similar in size and type. Use a significance calculator to see if the results are not random. Reliable results help you make better decisions.
See Also
Exploring Global Trends in Automated Retail: Micromarkets vs Smart Stores
Launching a Low-Cost AI-Driven Convenience Store Successfully
Understanding Corner Store Essentials and Their Importance Today