Ecommerce Shopping Journey

Have you ever wondered why some ecommerce sites turn visitors into loyal customers while others struggle to keep buyers coming back? The ecommerce shopping journey shapes every interaction a customer has with a store, from first click to repeat purchase. When businesses understand and optimize the customer journey, they see real gains. For example, addressing friction points can boost conversion rates significantly, and loyal customers often spend 67% more than new shoppers. The table below highlights how key improvements in the ecommerce shopping journey drive better retention and sales:
Metric / Industry Aspect | Statistic / Range |
|---|---|
Average ecommerce customer retention rate | 30% - 38% |
Repeat customers' revenue contribution | Over 61% |
Existing customers spend more than new customers | 67% more |
Profit increase from 5% retention rate boost | 25% - 95% increase in profits |
Many customers leave before checking out or never return after a single purchase. Every ecommerce business faces these challenges in the customer journey. Reflect on where your own ecommerce journey loses customers or creates frustration—solving these issues can transform your results.
Key Takeaways
Understanding and improving each stage of the ecommerce shopping journey boosts customer loyalty and sales.
Simplifying checkout and reducing friction can lower cart abandonment and increase conversions.
Personalized experiences make customers feel valued and drive repeat purchases and higher order values.
Collecting data and customer feedback helps identify pain points and guide effective improvements.
Regular testing and updates keep the shopping experience fresh, leading to sustained growth and satisfaction.
Ecommerce Shopping Journey Overview
What Is the Ecommerce Shopping Journey
The ecommerce shopping journey describes every step a customer takes when interacting with an e-commerce business. This journey starts with the first visit and continues through browsing, purchasing, and even after the sale. Analytical research and market surveys identify several key components that define the ecommerce customer journey:
Browsing products and reading detailed descriptions
Adding items to the cart and moving through checkout
Interacting with customer service, handling returns, and managing price adjustments
Accessing clear product information and seamless navigation
Experiencing emerging technologies like AR, VR, AI, and machine learning for personalized recommendations and interactive features
Completing transactions easily and enjoying a smooth post-purchase experience
Market research methods such as satisfaction surveys, mystery shopping, and user experience interviews help businesses understand these stages. The ecommerce shopping journey shapes the entire online shopping experience and influences how customers feel about a brand.
Why It Matters
A well-designed ecommerce customer journey leads to better customer experience, higher sales, and stronger loyalty. Recent industry data from the Dimension Data Global CX Benchmarking Report (2023) shows that 84% of companies focusing on customer experience—directly improved by ecommerce journey mapping—report increased revenue. This strong link between mapping the ecommerce shopping journey and revenue growth highlights its importance for every e-commerce business.
Optimizing each stage of the ecommerce customer journey brings measurable results. The table below shows how improvements in site speed, checkout, and personalization impact customer loyalty and sales:
Optimization Factor | Statistic / Impact | Effect on Customer Loyalty and Sales Growth |
|---|---|---|
Site Speed | Faster sites improve user experience and increase sales | |
Global cart abandonment rate ~69.82%; causes include hidden fees, complicated checkout | Streamlining checkout reduces abandonment, boosting sales | |
Personalized Recommendations | 49% of consumers buy items due to personalized recommendations | Personalization increases average order value and customer satisfaction |
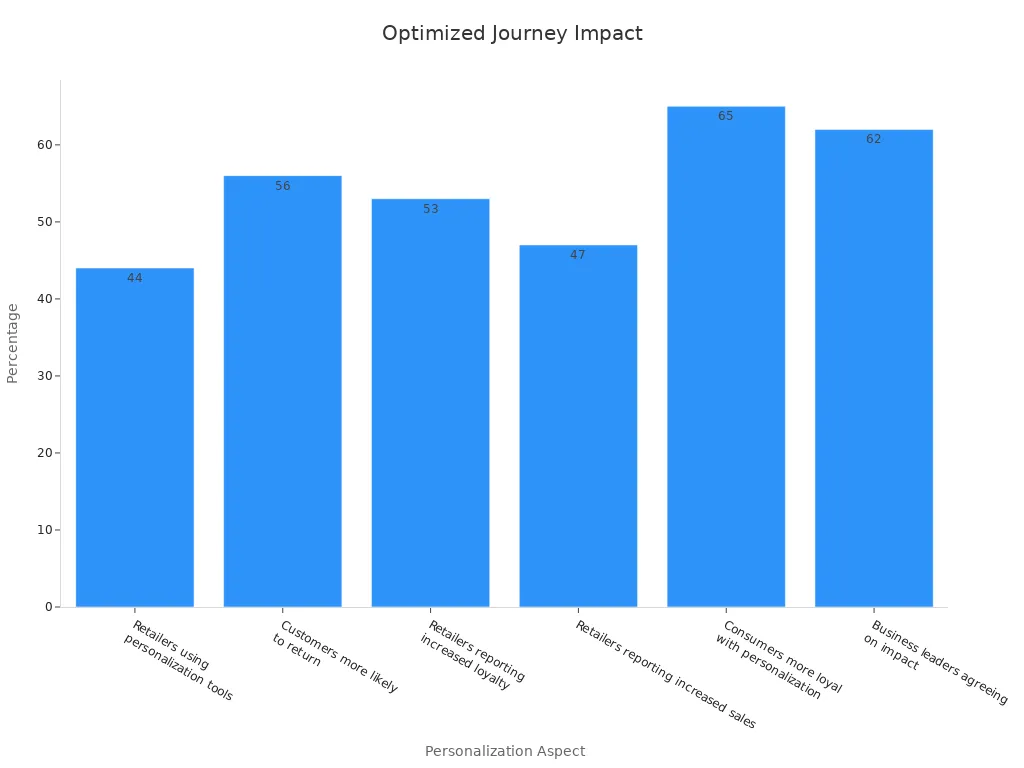
Personalization stands out as a key driver for customer retention and repeat purchases. The chart below shows how different personalization aspects impact loyalty and sales growth:
E-commerce businesses that invest in mapping and optimizing the ecommerce customer journey see more loyal customers, higher acquisition rates, and greater sales. A seamless online shopping experience keeps customers engaged and encourages them to return.
E-commerce Customer Journey Stages

The e-commerce customer journey includes several distinct stages. Each stage shapes how customers interact with a brand, from the first moment of awareness to becoming loyal advocates. Understanding these stages helps businesses improve customer engagement, increase sales, and build long-term relationships.
Awareness
The awareness stage marks the beginning of the e-commerce customer journey. At this point, customers first learn about a brand or product. Companies use digital ads, social media, search engines, and influencer partnerships to capture attention. Content marketing, such as blog posts and videos, also plays a key role in building awareness.
CRM systems help businesses track where customers discover their brand. These systems collect data from website visits, ad clicks, and social media interactions. By analyzing this data, companies can identify which channels drive the most customer engagement and optimize their marketing strategies.
Tip: Brands that invest in early-stage content and data-driven lead nurturing reach buyers before competitors. This early presence increases the chance of moving customers further along the journey.
Consideration
During the consideration stage, customers compare products, read reviews, and seek more information. They evaluate options based on features, price, and reputation. Educational content, such as buying guides and comparison charts, supports customers as they weigh their choices.
Businesses use CRM automation to send targeted emails and personalized recommendations. Lead scoring helps prioritize the most engaged customers. By refining personas and optimizing product positioning, companies like Rewind have doubled product installations and improved alignment between marketing and sales teams. This approach shortens the conversion funnel and increases acquisition rates.
A strong consideration stage builds trust and keeps customers interested. Companies that provide clear information and responsive support see higher customer engagement and a smoother transition to the next stage.
Decision
The decision stage is where customers make a purchase. This phase is critical for the ecommerce customer journey, as it directly impacts sales and conversion rates. Businesses focus on streamlining the checkout process, offering secure payment options, and providing incentives like discounts or free shipping.
The table below highlights key metrics that measure success during the decision stage:
Measurable Outcome / KPI | Description / Reported Statistic |
|---|---|
Conversion Rate | Percentage of visitors who complete a purchase during Decision phase |
Cart Abandonment Rate | Average rate of 69.57% across industries (Baymard Institute, 2023) |
Average Order Value (AOV) | Average monetary value of orders placed |
Checkout Completion Time | Time taken by customers to complete the checkout process |
Payment Success Rate | Percentage of successful payment transactions |
Coupon Usage Rate | Frequency of coupon or discount code usage |
First-time vs. Returning Purchaser Ratio | Ratio indicating customer loyalty and repeat purchase behavior |
Funnel analysis and continuous testing, such as A/B testing, help businesses optimize these metrics. Improving the decision stage leads to higher conversion rates and increased revenue.
Retention
Retention focuses on keeping customers engaged after their first purchase. This stage is vital for the e-commerce customer journey because loyal customers spend more and return often. Companies use loyalty programs, personalized offers, and excellent customer service to encourage repeat purchases.
Customer Retention Rate (CRR) tracks the percentage of customers who return over time.
Repeat Purchase Rate (RPR) measures how many customers buy again, directly linking to customer lifetime value.
Churn Rate identifies how many customers stop buying, helping businesses spot retention risks.
Customer Engagement Score predicts which customers are likely to stay or leave.
Retention strategies deliver measurable results. For example, a 5% increase in retention can boost profits by 25% to 95%. Brands like Amazon Prime and Sephora achieve high retention rates through personalized rewards and experiences. These companies use tools like RFM analysis to identify high-value customers and tailor their approach. Email marketing and loyalty programs also show strong returns, with existing customers spending about 67% more than new ones.
Advocacy
Advocacy is the final stage of the ecommerce customer journey. Satisfied customers become brand advocates, sharing positive experiences and referring others. Advocacy drives organic growth and strengthens the brand’s reputation.
Companies identify advocates through CRM data and Net Promoter Scores. They encourage advocacy by requesting testimonials, launching referral programs, and rewarding loyal customers. The table below shows how optimized strategies impact advocacy:
Brand | Strategy Implemented | Key Metrics / Outcomes |
|---|---|---|
Never Fully Dressed | Loyalty program integrated with email platform | 50% increase in customer spend; 1/3 of revenue from repeat customers |
RawFedK9 | Hyper-personalized interactions, loyalty rewards | Maintained over 98% customer engagement |
BrewDog | Loyalty program enhancements | 400% increase in purchase frequency; 100%+ increase in average order value and click-through rates |
Advocacy completes the e-commerce customer journey by turning loyal customers into powerful promoters. This stage not only increases customer engagement but also reduces acquisition costs and drives sustainable sales growth.
Customer Journey Pain Points

Cart Abandonment
High cart abandonment remains a major challenge in the ecommerce customer journey. Many customers add items to their carts but leave before completing the purchase. Research shows that cart abandonment rates on major ecommerce platforms usually range from 60% to 85%. Several factors contribute to this issue:
43% of US online shoppers abandon carts because they are just browsing or not ready to buy. This behavior is common and reflects natural shopping habits.
18% of shoppers leave due to a checkout process that feels too long or complicated.
Usability studies reveal that the average checkout flow contains about 23 form elements. An ideal checkout would have only 12 to 14 elements, making the process much easier for customers.
Improving checkout usability could increase conversion rates by over 35%, potentially recovering billions in lost orders across the US and EU.
Ecommerce businesses that simplify the checkout process and reduce unnecessary steps can lower high cart abandonment and improve customer satisfaction.
Navigation Issues
Navigation problems disrupt the ecommerce customer journey and frustrate customers. Common issues include inconsistent navigation menus, poor product filtering, broken layouts, and complex category structures. These problems often lead to higher bounce rates and more abandoned carts.
Data tools like Google Analytics and heatmaps help businesses identify where customers struggle during their journey.
Broken layouts, such as overlapping fields or malfunctioning dropdowns, cause users to leave the site.
Poor filtering and sorting make it hard for customers to find products, reducing satisfaction and sales.
Leading ecommerce sites like Amazon and Walmart use detailed filters and intuitive design to improve navigation.
Continuous testing and user feedback help ecommerce brands optimize navigation, making the journey smoother for every customer.
Low Loyalty
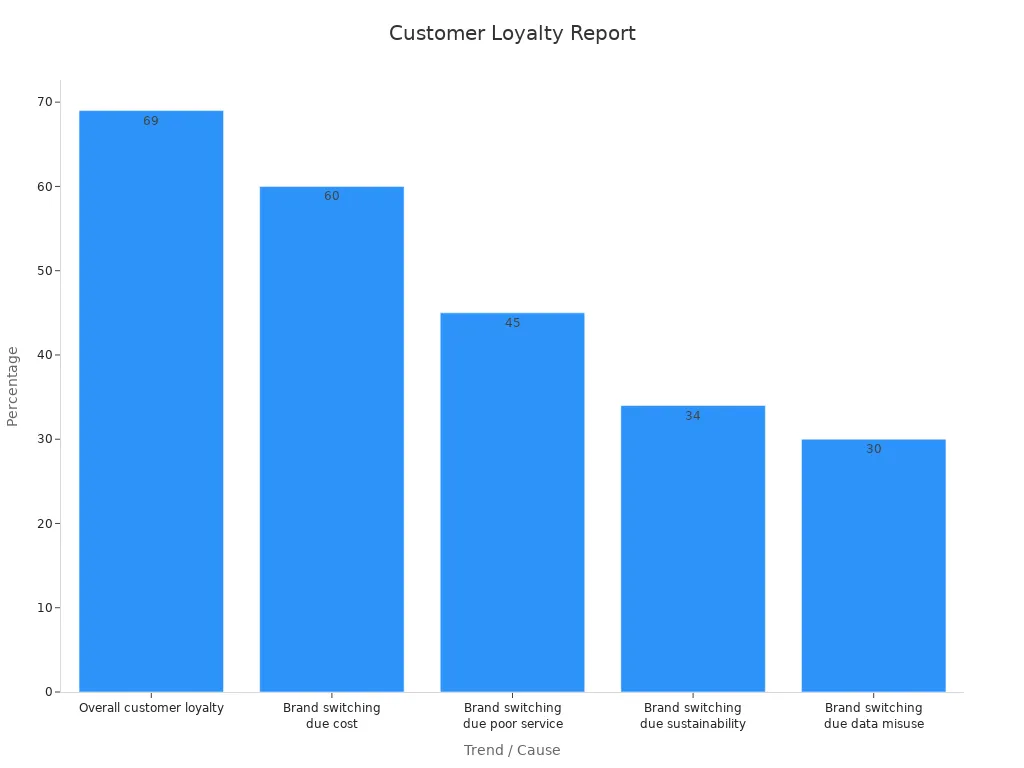
Low customer loyalty has become a growing concern in the ecommerce industry. Recent reports show a clear decline in loyalty among online shoppers. The table below highlights key trends and causes:
Trend / Cause | Statistic (2024) | Change / Note |
|---|---|---|
Overall customer loyalty | Declined from 77% in 2022 | |
Brand switching due to cost | 60% switched | Slight increase from 58% in 2023 |
Brand switching due to poor service | 45% switched | Increased from 42% in 2023 |
Brand switching due to sustainability | 34% switched | Environmental concerns increasingly influential |
Brand switching due to data misuse | 30% switched | Privacy concerns impacting loyalty |
Cost sensitivity, poor service, sustainability, and privacy concerns drive customers to switch brands. The rise of AI-powered platforms makes it easier for customers to compare options and change brands quickly. Ecommerce businesses must focus on loyalty programs, personalized experiences, and ethical practices to strengthen the customer journey and build lasting relationships.
Ecommerce Customer Journey Optimization
Reducing Friction
Reducing friction in the ecommerce customer journey helps customers move smoothly from browsing to purchase. Many shoppers leave before buying because of confusing steps or slow websites. When businesses streamline processes, they see real results. For example, Wreaths Across America simplified its checkout and saw a 37% increase in conversions, a 63% rise in revenue, and a 28% jump in orders. Research from Baymard and BigCommerce shows that most cart abandonment happens when the checkout process feels difficult. Companies can reduce friction by using progress bars, showing all prices upfront, and allowing guest checkout. Mobile-friendly designs with large buttons also keep customers engaged. Behavioral analytics can cut friction in data fields by 20%, making the journey easier and boosting conversions.
Friction Reduction Area | Intervention Details | Quantitative Outcome |
|---|---|---|
Checkout Bug Fix | Fixed bug causing cart contents to disappear | Conversion rate doubled within 6 months |
Mobile Friction Reduction | Redesigned popup, simplified navigation, faster loads | Mobile click rage dropped from 51% to 15% |
Conversion rates increased by 37% | ||
Simplifying for Older Users | Displayed promo codes, streamlined filters, clickable images | Reduced cart abandonment; increased add-to-cart clicks |
Improving Checkout
A smooth checkout process is key to a positive customer experience. Many ecommerce businesses lose sales when checkout is slow or confusing. Baby Bunting improved its payment system and saw more successful transactions and happier customers. Adding local payment methods increased completed transactions by 25%. Mobile checkout optimization led to a 15% boost in mobile conversions. Dynamic routing of payments also reduced failures. Companies that offer multiple payment options and simple forms help customers finish their purchases. Analytics from payment platforms show where customers get stuck, so businesses can fix problems quickly. These improvements raise authorization rates and make the customer journey more enjoyable.
Improvement Area | Measurable Outcome |
|---|---|
Support for local payment methods | |
Mobile checkout optimization | 15% boost in mobile conversion rates |
Payment orchestration | Uplift in authorization rates |
Personalization
Personalization shapes the ecommerce customer journey by making each customer feel valued. Personalized experiences, such as tailored emails or product suggestions, increase customer engagement and loyalty. Market research shows that personalized product recommendations can raise average order value by up to 369% and drive 31% of site revenue. Conversion rates can jump by 288% with personalized suggestions. Segmented marketing campaigns based on customer data increase conversions by 50%. Behavioral data-driven personalization improves retention by 44%. Most customers prefer brands that remember their preferences and offer personalized experiences. Companies that use AI-driven recommendations see even higher growth in sales and lifetime value. Personalization not only boosts sales but also keeps customers coming back, turning one-time buyers into loyal fans.
Tip: Businesses that invest in personalized experiences see higher customer engagement, stronger loyalty, and greater profitability throughout the customer journey.
Customer Journey Mapping
Data and Analytics
Customer journey mapping starts with collecting the right data. Companies need to understand how people interact with their online store at every step. Research highlights several important data points for effective customer journey mapping:
Experiences at each service touchpoint, such as browsing, checkout, and delivery
Behavioral responses to new features or service innovations
Tracking these elements helps businesses see where the journey works well and where it needs improvement. Analytics tools can show which pages people visit most, how long they stay, and where they drop off. By using both qualitative and quantitative data, companies can map the journey and create a better omnichannel experience.
Feedback Collection
Collecting feedback at key customer touchpoints gives companies a clear view of what works and what does not. Post-purchase surveys, live chat, and social media monitoring reveal hidden problems and help explain why people abandon carts or leave the site. This feedback, when combined with data like cart abandonment rates, helps businesses find and fix pain points. For example, feedback can show if high shipping costs or a confusing checkout process cause people to leave. Companies that use feedback to refine their customer journey mapping see higher retention and more positive reviews. Tools like Qualtrics, SurveyMonkey, and Medallia make it easy to gather and analyze feedback.
Mapping Tools
The right tools make customer journey mapping easier and more effective. Leading platforms like Qatalyst use real user testing and emotional behavior insights to show how people feel at each step. TheyDo helps teams track every customer touchpoint and turn data into action. These tools support collaboration, centralize journey data, and monitor the impact of changes. Companies using customer journey mapping tools are much more likely to outperform competitors. By using these platforms, businesses can quickly spot friction points, such as slow shipping or checkout issues, and make targeted improvements. Templates and visual maps help teams see the entire journey and plan better experiences.
Examples
Seamless Checkout
Many ecommerce brands have transformed their checkout process to improve conversion rates and customer experience. A seamless checkout removes barriers that cause shoppers to abandon their carts. Brands like Strandbags personalize product suggestions and messages based on user behavior, which increases engagement and conversions. Freemius uses geo-targeting and localization, showing prices in the buyer’s currency and language, which lifts conversion rates for international buyers. Companies also add multiple payment options, such as digital wallets and Buy Now Pay Later, to meet customer preferences and reduce drop-offs.
Simplifying the checkout process builds trust and reduces cart abandonment. One-click checkout and express payment options like Apple Pay and PayPal help returning customers complete purchases quickly. Clear, real-time error messages prevent frustration and keep the process smooth.
The table below highlights how leading ecommerce brands optimize the customer journey through practical mapping techniques:
Ecommerce Brand Case Study | Background and Challenges | Practical Mapping Techniques Applied | Outcomes |
|---|---|---|---|
Declining loyalty and conversion rates despite high traffic | Optimized journey mapping to clarify touchpoints | Improved conversion rates, customer satisfaction, and loyalty | |
Low conversion rates and high acquisition costs | Innovated offerings and marketing based on journey insights | Enhanced market position and sustainable revenue growth | |
Outdated journey mapping, customer attrition | Comprehensive revision aligned with consumer behavior changes | Regained market share, improved engagement, increased sales |
Post-Purchase Engagement
Ecommerce brands that focus on post-purchase engagement see higher customer loyalty and repeat business. Companies like Amazon and Starbucks use data analytics to personalize offers and campaigns, which increases customer engagement and satisfaction. Analytical data shows that 93% of customers are likely to buy again from brands that provide excellent post-purchase service. Even a 5% increase in customer retention can boost profits by up to 95%.
Brands improve post-purchase engagement by sending personalized follow-ups, offering easy returns, and encouraging reviews or referrals. A smooth returns process makes 92% of customers more likely to return. When companies monitor engagement and respond to feedback, they build trust and long-term relationships. These strategies drive sales, foster loyalty, and support ongoing revenue growth.
Continuous Improvement
A/B Testing
A/B testing helps ecommerce businesses find what works best for their customers. Companies test different versions of web pages, emails, or features to see which one performs better. This method leads to smarter decisions and higher sales. Many successful brands use A/B testing to improve the customer journey.
Swiss Gear increased conversions by 52% after making product pages less cluttered and enlarging call-to-action buttons. During peak seasons, conversions rose as much as 137%.
Changing a call-to-action from “Sign Up” to “Learn More” boosted sign-ups by 40.6% for a major campaign.
Personalization based on user behavior can lift revenue by 10-25%. Most shoppers prefer buying from stores that offer personalized experiences.
Mobile optimization is key. Over 63% of traffic comes from mobile devices, but conversion rates are lower than desktop. Improving navigation, speed, and checkout for mobile users helps close this gap.
Trust-building features like clear return policies, customer reviews, and security badges reduce cart abandonment, which often reaches 70%.
Testing product tags, such as “Best Seller” or “New,” guides attention and increases sales. Wayfair uses bright red tags to highlight popular items.
Tip: Regular A/B testing of layouts, CTAs, and personalization features helps ecommerce brands stay ahead of changing customer preferences.
Iterative Updates
Ecommerce platforms improve by making small, regular changes based on feedback and data. This approach, called iterative updating, helps businesses adapt quickly and deliver better experiences.
Aspect | Impact on Customer Experience and Business Outcomes | |
|---|---|---|
Development Approach | Iterative and incremental, adapting to changes | Faster time to market, rapid feature delivery |
Flexibility | Emphasizes adaptability and quick responses | Ability to quickly respond to customer feedback and market trends |
Customer Engagement | Actively seeks and integrates customer feedback | Enhanced customer satisfaction and loyalty |
Risk Management | Continuous risk identification and mitigation | Reduced project risks and improved success rates |
Team Structure | Cross-functional teams with flexible roles | Improved collaboration and innovation leading to better customer outcomes |
Innovation | Encourages experimentation and rapid iteration | Differentiation and staying competitive in a dynamic market |
AI-powered updates also play a growing role. Recent studies show that platforms using AI for continuous improvements see higher customer satisfaction and more repeat purchases. By measuring key metrics like conversion rates and customer feedback, ecommerce teams can track progress and make informed decisions. This cycle of testing, learning, and updating keeps the customer journey fresh and effective.
Optimizing the ecommerce shopping journey delivers measurable gains in customer satisfaction, loyalty, and lifetime value. Each stage of the customer journey—from awareness to advocacy—impacts sales and retention. Key performance indicators such as conversion rate, cart abandonment, and customer retention rate highlight the value of continuous improvement. Companies that map and refine their ecommerce strategies see higher satisfaction and sustainable growth. Start analyzing your customer journey today to unlock greater ecommerce success and long-term loyalty.
Description & Importance | Supporting Statistical Data / Examples | |
|---|---|---|
Conversion Rate | Measures site effectiveness in turning visitors into customers. | Simple percentage calculation; actionable metric for optimization. |
Average Order Value (AOV) | Average revenue per transaction, helps maximize revenue without new customers. | Basic revenue/order division; supports upselling and bundling strategies. |
Customer Acquisition Cost (CAC) | Cost efficiency of acquiring new customers, critical for marketing budget optimization. | Requires detailed cost tracking; helps optimize marketing spend and profitability. |
Customer Lifetime Value (CLV) | Estimates long-term revenue from a customer, justifies acquisition spend and retention investment. | High complexity; requires historical data and analytics. |
Cart Abandonment Rate | Identifies friction points in checkout, enabling revenue recovery strategies. | Percentage calculation; actionable for immediate conversion improvements. |
Return on Ad Spend (ROAS) | Measures revenue generated per advertising dollar spent, indicating ad campaign profitability. | Example: Facebook Ads average ROAS 4:1; Wayfair maintains ROAS above 3:1. |
Customer Retention Rate (CRR) | Percentage of customers retained over time, indicating loyalty and satisfaction. | Example: Amazon Prime retention rate above 90%; Apple 92%; Costco 90%. |
Website Traffic & Organic Search | Tracks visitors and SEO effectiveness, crucial for sustainable, cost-effective growth. | Includes metrics like sessions, users, page views, rankings; organic search traffic is high intent and free. |
FAQ
What is an ecommerce customer journey map?
An ecommerce customer journey map shows each step a shopper takes on a website. It helps businesses see where customers face problems. Teams use this map to improve the shopping experience and increase sales.
How can businesses reduce cart abandonment?
Businesses can reduce cart abandonment by making checkout simple. They should show all costs early, offer guest checkout, and support many payment options. Fast-loading pages and clear instructions also help keep customers from leaving.
Why does personalization matter in ecommerce?
Personalization makes shoppers feel valued. It uses data to show products or offers that match each customer’s interests. This approach increases sales and builds loyalty because customers enjoy a more relevant experience.
Which tools help map the ecommerce customer journey?
Popular tools include Google Analytics, Hotjar, and TheyDo. These platforms track user actions, collect feedback, and create visual maps. Teams use these insights to find and fix pain points in the journey.
How often should companies update their customer journey map?
Companies should review and update their journey map every few months. Regular updates help teams spot new issues and adapt to changing customer needs. This practice keeps the shopping experience fresh and effective.