Key KPIs to track for autonomous store success in Convenience store chains & small-format grocery.
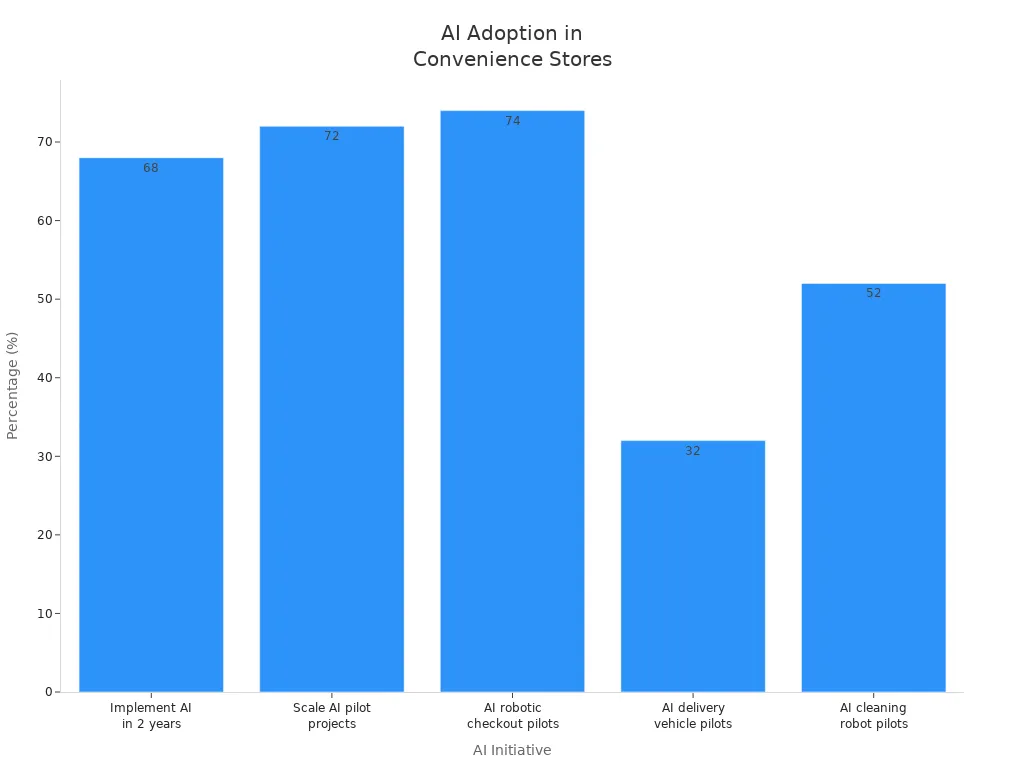
You need measurable KPIs to drive autonomous store success. Key KPIs include sales per square foot, average order value, transaction volume, labor cost savings, inventory accuracy, and system uptime. Data from pilot autonomous store projects shows that 68% of convenience stores plan to implement AI solutions, while 74% engage in AI robotic checkout pilots. These numbers highlight how data analysis, actionable reporting, and robust reports and analytics shape store performance. You can use reporting to track store growth, improve grocery operations, and ensure each pilot autonomous store achieves success.
Description | Percentage |
|---|---|
Convenience stores looking to implement AI solutions within 2 years | 68% |
Stores in AI pilot projects planning to scale | 72% |
Engaged in AI robotic checkout pilot projects | 74% |
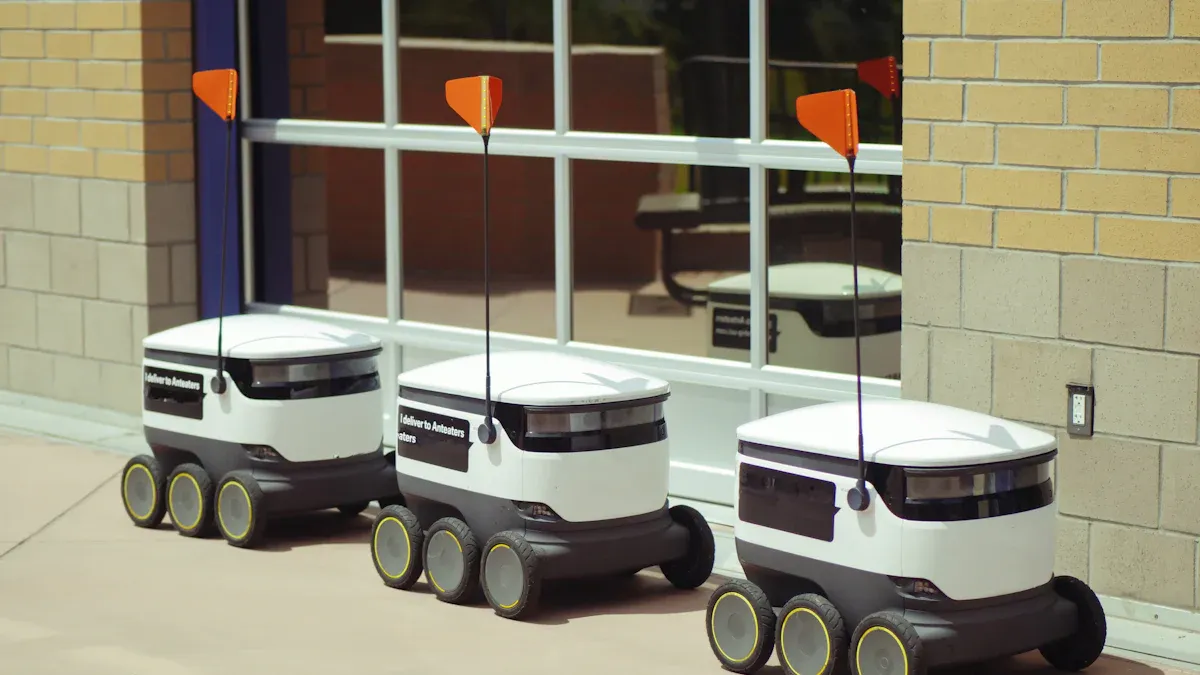
Piloting AI-driven autonomous delivery vehicles | 32% |
Piloting AI-enabled autonomous cleaning robots | 52% |
Key Takeaways
Track sales per square foot to measure how efficiently your store uses space. Higher sales indicate better product placement and layout.
Monitor average order value (AOV) to see how much customers spend per visit. AOV often increases with faster checkout processes.
Use daily visitor count and conversion rate together to understand your store's traffic and sales performance. This helps identify areas for improvement.
Focus on labor cost savings to reduce expenses by using autonomous technology. This can lead to significant long-term savings.
Regularly review customer satisfaction scores to gauge how happy shoppers are. High scores can lead to more repeat visits and loyalty.
Key KPIs for Sales Performance
Sales per Square Foot
You can measure how well your autonomous store uses its space by tracking sales per square foot. This KPI shows how much revenue you generate for every square foot in your store. High sales per square foot mean you use your space efficiently. In an autonomous environment, you often see better results because technology helps you optimize product placement and reduce wasted space. You can use this data to compare different locations and find ways to improve your layout.
Average Order Value (AOV)
Average Order Value, or AOV, tells you how much a customer spends each time they visit your store. In autonomous stores, AOV often increases because the checkout process is faster and more convenient. Recent data shows that Sam’s Club, using Scan & Go technology, saw a 27% increase in AOV. Kroger, with smart carts, saw a 12% increase. You can see these results in the table below:
Store Type | Average Order Value Increase |
|---|---|
Sam's Club (Scan & Go) | 27% |
Kroger (Smart Carts) | 12% |
This data highlights how autonomous technology can boost your store’s revenue. When you track AOV, you can spot trends and test new strategies to encourage larger purchases.
Sales Per Customer
Sales per customer measures the average amount each shopper spends in your store. This KPI helps you understand customer buying habits. In an autonomous store, you can use data from every transaction to see if shoppers buy more when they have a frictionless experience. If you notice sales per customer rising, you know your autonomous system is working well. You can also use this metric to set goals for your team and test new promotions.
Transaction Volume
Transaction volume counts the total number of purchases in your store over a set period. High transaction volume means more people choose your autonomous store for their shopping needs. You can use data from your system to track busy times and plan for peak hours. This KPI helps you measure the impact of marketing campaigns and store improvements. When you see transaction volume rise, you know your autonomous approach attracts more shoppers.
Conversion Rate
Conversion rate shows the percentage of visitors who make a purchase in your store. In an autonomous store, you want this number to be as high as possible. A strong conversion rate means your store layout, product selection, and technology work together to turn visitors into buyers. You can use data from your entry and exit systems to calculate this KPI. If your conversion rate drops, you can use the data to find and fix problems quickly.
Tip: Track these KPIs regularly. Use the data to make small changes and watch how your store performance improves over time.
Customer Experience KPIs

You need to measure the quality of the autonomous shopping experience to understand what works best for your store. These KPIs help you see how customers interact with your store and how you can improve their experience. When you track these metrics, you can build a strong customer experience strategy and boost customer loyalty.
Daily Visitor Count
Daily visitor count tells you how many people enter your store each day. This number gives you a clear view of your store’s popularity. If you see fewer visitors, your sales may drop. If your visitor count stays the same but sales fall, you may have a conversion problem instead of a traffic problem. You should always check both visitor count and conversion rate to find the real reason for sales changes. Data shows that a drop in visitor traffic leads to lower sales, so you need to watch this KPI closely.
Dwell Time
Dwell time measures how long customers spend in your store during each visit. Longer dwell time can mean customers enjoy the autonomous experience and feel comfortable exploring. If dwell time is too short, customers may not find what they need or may feel rushed. You can use data from sensors or cameras to track this metric. When you see changes in dwell time, you can adjust your store layout or product placement to improve the experience.
Repeat Visit Rate
Repeat visit rate shows how often customers return to your store. High repeat visit rates mean customers like the autonomous experience and want to come back. This KPI helps you measure customer loyalty and the success of your customer experience strategy. You can use loyalty programs or digital receipts to track repeat visits. If you see this number drop, you may need to improve your store’s offerings or the overall experience.
Customer Satisfaction Scores
Customer satisfaction scores help you understand how happy customers feel after shopping in your store. In autonomous stores, you can use surveys, feedback kiosks, or digital prompts to collect these scores. Many stores use advanced methods to measure satisfaction, such as Enhanced Customer Effort Score (CES), Containment Rate, and Resolution Quality Index. These tools combine behavioral analysis, conversation sentiment, and resolution tracking to give you a full picture of the customer experience.
Metric Name | Description |
|---|---|
Enhanced Customer Effort Score (CES) | Combines behavioral analysis, conversation sentiment, and resolution pathway tracking. |
Containment Rate | Measures AI resolution effectiveness without the need for human escalation. |
Agent Assist Utilization | Assesses how effectively human agents utilize AI recommendations. |
Resolution Quality Index | Evaluates overall effectiveness beyond a simple resolved/not resolved outcome. |
Channel Transition Efficiency | Ensures seamless context retention across different customer touchpoints. |
You can use these data-driven customer tools to spot trends and fix problems quickly. High satisfaction scores lead to more repeat visits and stronger customer loyalty.
Frictionless Checkout Rate
Frictionless checkout rate measures how many customers complete their purchases without any problems or delays. In an autonomous store, you want this number to be as high as possible. A smooth checkout experience makes customers happy and encourages them to return. You can use data from your checkout systems to track this KPI. If you see the rate drop, you may need to check your technology or train your staff to help customers.
Customer Retention Rate
Customer retention rate shows how many customers keep coming back to your store over time. This KPI is important for building long-term success. High retention means your autonomous experience meets customer needs and expectations. You can use loyalty programs, digital receipts, and follow-up surveys to measure retention. When you focus on retention, you build a loyal customer base and increase your store’s revenue.
Tip: Use data from all these KPIs to improve your autonomous store. When you understand how customers feel and behave, you can make smart changes that boost customer loyalty and create a better experience for everyone.
Operational Efficiency KPIs
You need to focus on operational efficiency to keep your autonomous store profitable and sustainable. These KPIs help you control costs, reduce waste, and improve store performance. When you track these metrics, you can use data to make smart decisions and boost efficiency.
Labor Cost Savings
Labor cost savings show how much you reduce expenses by using autonomous technology. You do not need cashiers or full-time staff, so you cut costs over time. Traditional stores face higher labor costs because of wage laws and staff shortages. The table below compares labor costs in different retail models:
Retail Model | Labor Cost Characteristics |
|---|---|
Autonomous Retail | Eliminates the need for cashiers and full-time staff, leading to significant operational cost reductions over time. |
Traditional Retail | Ongoing labor costs are volatile due to minimum wage laws and labor shortages, resulting in higher long-term expenses. |
You can use data from your payroll and store systems to measure these savings and improve operational efficiency.
Inventory Accuracy
Inventory accuracy means you know exactly what you have in your store at all times. Autonomous stores use AI, robotics, and IoT to track inventory in real time. These technologies help you reduce errors and keep shelves stocked. Retailers using inventory robots report up to 90% fewer pricing errors and a 60% drop in out-of-stocks. When you improve inventory accuracy, you boost efficiency and reduce waste. Integration of AI and robotics can raise inventory accuracy to 99%.
Technology | Contribution to Inventory Accuracy |
|---|---|
Artificial Intelligence (AI) | Uses predictive analytics for demand forecasting, automates reorder processes, and integrates with IoT for real-time tracking. |
Automated Replenishment | Maintains ideal inventory levels by predicting when stock needs replenishment based on sales patterns. |
Robotics and Automation | Automates repetitive tasks, reducing human error and increasing speed in inventory management. |
IoT Integration | Provides real-time data and analytics for inventory management, helping to maintain stock levels and reduce waste. |
Cloud-based Solutions | Allows real-time access to inventory data, facilitating seamless data sharing and integration across locations. |
Average Inventory Turnover Ratio
Average inventory turnover ratio tells you how often you sell and replace your stock. High turnover means you move products quickly and keep your store fresh. Autonomous systems use data to track sales and automate reordering. This improves inventory management and keeps your shelves full. You can compare turnover ratios across locations to find the best practices for efficiency.
Shrinkage Rate
Shrinkage rate measures the loss of inventory from theft, errors, or crime. In autonomous stores, you still face risks like shoplifting and organized retail crime. The average shrinkage rate is about 1.4% of sales. You need to use data from your inventory and security systems to spot problems early. Common causes of shrinkage include shoplifting, employee theft, and administrative errors. Reducing shrinkage improves operational efficiency and protects your profits.
Food Waste Percentage
Food waste percentage shows how much of your inventory goes unsold and must be thrown away. Autonomous stores can use data and clear date labeling to cut waste. For example, Tesco reported food waste as low as 0.5% of sales in the UK. Small changes, like consumer education and better labeling, help reduce surpluses. Half of companies that invested in food waste reduction saw a 14-fold return on investment. Lower food waste means higher efficiency and better sustainability.
System Uptime
System uptime tracks how often your autonomous technology works without interruption. High uptime means your store runs smoothly and customers get a good experience. You need to monitor data from your systems to catch problems fast. When you keep uptime high, you improve operational efficiency and avoid lost sales.
Tip: Use data from these KPIs to find weak spots and make changes. When you focus on operational efficiency, you build a stronger, more sustainable autonomous store.
Technology & Autonomous Systems
You need reliable technology to run a successful autonomous store. Tracking the right KPIs helps you spot problems and improve your systems. Focus on these key areas to keep your store running smoothly and your customers happy.
Error Rate
Error rate measures how often your autonomous checkout and automated checkout systems make mistakes. High error rates can lead to lost sales and unhappy customers. In small-format grocery stores, self-checkout systems can cause shrinkage rates between 3.5% and 4%. These systems account for up to 23% of unknown store losses. About 15% of shoppers admit to stealing at self-checkouts, and many plan to do it again. You need to use data from your technology to find the main sources of errors and fix them fast.
Self-checkout systems can increase shrinkage.
Many losses come from unknown sources.
Some customers take advantage of automated checkout.
Downtime
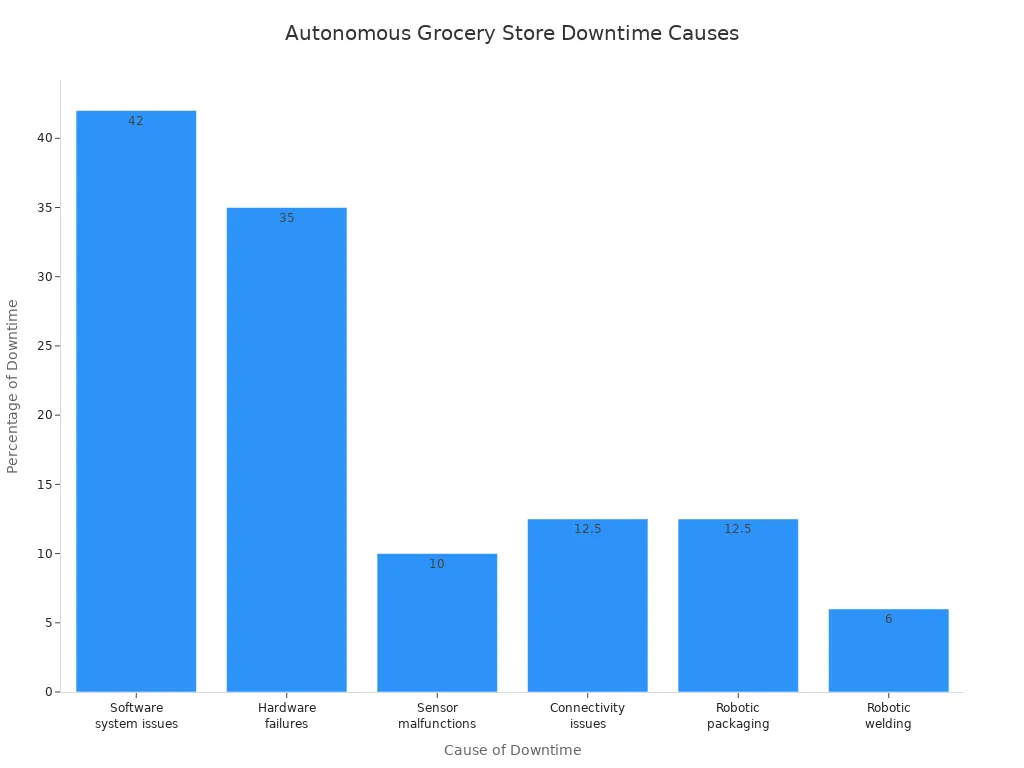
Downtime shows how often your technology stops working. Even a short outage can hurt your store’s sales and customer trust. Most downtime comes from software or control system issues (42%), hardware failures (35%), sensor malfunctions (8–12%), and connectivity problems (10–15%). Use data from your store systems to track downtime and find patterns.
Cause of Downtime | Percentage of Downtime |
|---|---|
Software or control system issues | 42% |
Hardware failures | 35% |
Sensor malfunctions | 8–12% |
Connectivity issues | 10–15% |
Speed of Issue Resolution
Speed of issue resolution tells you how quickly your team can fix technology problems. Fast response times keep your store running and customers satisfied. Use analytics and real-time data to spot issues early. When you solve problems quickly, you reduce downtime and keep your technology reliable.
Grocery Store POS System Integration
Grocery store pos system integration is key for a smooth autonomous experience. You need your technology to work together, from checkout to inventory to online ordering and delivery. Many stores face challenges with technology integration. Older systems may not work well with new autonomous technology. Data privacy and security are also big concerns. Staff and customers need training to adapt to new systems.
Challenge Type | Description |
|---|---|
Older systems often struggle to integrate with modern autonomous technologies. | |
Data Privacy and Security | Protecting customer data is crucial and requires strong security measures. |
Staff and Customer Adaptation | Training and support help everyone adjust to new technology. |
You should use data from your grocery store pos system and other technology to track integration success. Good technology integration supports all parts of your store, including analytics, inventory, and customer service. When your grocery store pos system works well with other technology, you can manage your store better and offer features like online ordering and delivery. Many stores use grocery store pos system data to improve technology integration and support automated checkout. Grocery store pos system integration also helps connect your store with other grocery store management systems.
Tip: Review your technology integration KPIs often. Use data from your grocery store pos system to find weak spots and improve your store’s technology.
Profitability & Growth KPIs
You need to track profitability and growth KPIs to understand how well your autonomous store performs. These metrics show if your store makes money, grows, and stays ahead in a changing market. When you use data from your store, you can make smart choices that help your business succeed.
Gross Margin Percentage
Gross margin percentage tells you how much profit you keep from every sale after paying for the goods. You should watch this KPI closely because it shows if your store runs efficiently. Most autonomous convenience stores have a gross margin percentage between 20% and 30%. Traditional stores also fall in this range. If you sell fresh-cooked food, you can reach even higher margins. You can use data from your sales and inventory to check your gross margin and find ways to improve it.
Autonomous convenience stores: 20-30% gross margin
Traditional stores: 20-30% gross margin
Fresh-cooked food: Higher margins possible
A strong gross margin means your store covers costs and earns profit. You can use this KPI to compare different store formats and product types.
ROI on Automation
ROI on automation shows how much money you earn for every dollar you invest in automation technology. You need to measure this KPI to see if your investments pay off. Most autonomous grocery stores see an average ROI of $3.50 for every $1 invested. The payback period is usually 14 months, which means you get your money back quickly. This return is two to three times higher than traditional technology investments.
Metric | Value |
|---|---|
Average ROI | $3.50 for every $1 invested |
Average Payback Period | 14 months |
You can use data from your store systems to track ROI and plan future automation projects. Many organizations invest in several AI applications to boost returns.
Store Conversion Rate
Store conversion rate measures how many visitors become paying customers. You want this number to rise as your autonomous systems improve. High conversion rates mean your store attracts the right customer and gives them a good experience. You can use data from entry and checkout systems to track this KPI. When you see conversion rates climb, you know your automation and customer experience strategies work well.
Tip: Review these KPIs often. Use data to set goals, measure progress, and guide your store’s growth. When you focus on profitability and growth, you build a strong future for your autonomous store.
Using KPIs for Continuous Improvement
Setting Benchmarks
You need clear benchmarks to measure your autonomous store’s progress. Benchmarks help you see if your store performs well or needs improvement. You can use industry standards to set targets for each KPI. For example, you can aim for an average order value of $848 or keep spoilage and shrinkage between 1% and 4% of revenue. Customer satisfaction scores should stay above 80%. Use the table below to compare your store’s results with industry benchmarks:
KPI | Definition | Industry Benchmark |
|---|---|---|
Average Order Value (AOV) | Average revenue per transaction | Target $848 |
Spoilage & Shrinkage % | Inventory lost to waste, damage, or theft | 1% - 4% of revenue |
Customer Satisfaction Score | Customer happiness and retention | Over 80% positive |
You can find more benchmarks from trusted sources like Financial Models Lab and POS Nation. These help you set realistic goals for your autonomous store.
Aligning KPIs with Business Goals
You should connect each KPI to your main business goals. Start by choosing three to five top objectives for your autonomous store. For example, you might want to improve profit margins, reduce shrinkage, or increase loyalty program signups. Each KPI should match one of these goals. This makes sure your data supports your store’s strategy. The table below shows how to align KPIs with business objectives:
Step | Description |
|---|---|
1 | Align with Business Objectives: Pick your most important goals and link each KPI to a goal. |
When you align KPIs with your store’s goals, you use data to drive real results.
Driving Continuous Improvement
You can use data from your autonomous store to make smart changes. Start by collecting data to understand how your store performs. Review this data often to spot problems early. Analyze KPIs like customer satisfaction, transaction times, and inventory accuracy. Make quick adjustments when you see issues. Standardize your autonomous processes to prepare your store for growth. Use these steps to keep improving:
Review data often to find problems.
Analyze KPIs to measure success.
Standardize autonomous practices for growth.
Tip: Continuous improvement helps your autonomous store stay ahead. Use data to guide every decision and keep your store running smoothly.
You drive autonomous store success by tracking the right KPIs. These KPIs help you measure sales, customer experience, and operational efficiency. Use data from every store to spot trends and make smart decisions. Start with a phased approach. Mobile data capture and fixed cameras can boost on-shelf availability and planogram compliance. Review your data often. Update your KPIs as your autonomous store grows. This keeps your store ready for new technology and changing business needs.
FAQ
What makes an autonomous store different from a regular store?
You will find that an autonomous store uses technology to run without cashiers or much staff. This type of store relies on sensors, cameras, and software to track what you buy and help you check out quickly.
How do you keep an autonomous store secure?
You can use cameras, sensors, and smart software to watch for theft or mistakes. An autonomous store tracks every item and every shopper. This helps you spot problems fast and keep your store safe.
Why should you track KPIs in an autonomous store?
You need to track KPIs to see how well your autonomous store works. These numbers show you if your store makes money, keeps customers happy, and runs smoothly. You can use this data to make your store better.
Can an autonomous store work in small spaces?
Yes, you can set up an autonomous store in a small area. The technology helps you use every inch of your store. You can fit more products and serve more customers without needing extra staff.
How do you improve customer experience in an autonomous store?
You can use data from your autonomous store to see what customers like. You can change your store layout, add new products, or fix problems fast. This helps you make your store a better place to shop.
See Also
Comparing Micromarkets And Smart Stores In Global Retail
Understanding The Growth Of AI-Driven Corner Shops
Examining Walgreens Self-Checkout: Benefits And Hurdles