ROI of Cashierless Store Technology Your Key to Smart Savings

The ROI formula is simple: (net profit from investment ÷ cost of investment) × 100. Do this math before you buy cashierless technology. This key step shows the difference between smart savings and costly guessing. You will see exactly what the system gives back compared to what it costs. A positive result means the spend is worth it. A negative one protects your budget.
This post breaks the math into four parts. First, you add up all investment costs. Next, you measure the benefits. Then you follow a worked example, ROI of cashierless store technology – scenario 12, from setup to the final percentage. Finally, you learn to understand the result.
Key Takeaways
Use the ROI formula to compare costs and benefits before you buy cashierless technology.
List every cost you pay once and every cost you keep paying, so you don't miss any hidden expenses.
Use your own store data to measure benefits like higher sales and labor savings.
Use the example to see how the math works step by step.
Understand the percentage by looking at the situation around it. Also think about big-picture factors beyond just the number.
The ROI of Cashierless Store Technology Formula
How the Calculation Works
The formula is: ROI = (net profit from investment ÷ cost of investment) × 100. Net profit from investment means the total benefits you gain minus every cost you pay. Cost of investment means the full price of the system, including one-time and ongoing expenses.
You multiply by 100 to turn the ratio into a percentage. A result of 50 means you get back half your investment in net profit. A result of 150 means you gain one and a half times the cost. The percentage gives you one number to compare against other uses of your budget.
Run the math on your own figures, not on a vendor's brochure. Your store size, traffic patterns, and labor costs shape the result. The formula works only as well as the numbers you feed it.
Why It Guides Your Decision
This calculation stops you from spending too much. A cashierless system has a real price tag, and excitement about the technology can blur your view of the return. The formula makes you list every cost and every benefit before you sign a contract. You see the full picture, not just the headline features.
The calculation also supports a smart-savings decision. You learn whether the system pays for itself in a reasonable time or strains your cash flow for years. You can test a phased rollout against a full deployment and compare the percentages. You can adjust assumptions and watch the result move.
A negative or thin result does not automatically kill the project. It tells you to negotiate harder, start smaller, or wait. Either way, you decide with evidence instead of hope. That discipline is the core of smart savings, and it sets up the worked example later in this post, ROI of cashierless store technology – scenario 12.
Total Investment Costs
One-Time Implementation Costs
You begin with the money you pay upfront. For most stores, hardware is the biggest cost. This includes sensors, cameras, and self-service kiosks, plus any smart shelves or cart parts your design needs. Software licensing and initial setup come next. Vendors charge for the platform license, setup, and connection to your point-of-sale and inventory systems. Also plan for a site survey, because many vendors charge for an assessment before they give you a quote.
Installation adds cabling, mounting, and network work. Store layout changes may come next, like new entry gates or reworked checkout areas. Older buildings sometimes need electrical upgrades, and you pay those costs. Staff training finishes the list. You pay for the hours your team spends learning the new workflow. Every number here changes with store size, ceiling height, and vendor. Get written quotes and list each item before you add them up.
Ongoing Operational Expenses
The system keeps costing money after opening day. Software subscriptions usually bill monthly or yearly per store or per lane. Ask if the price goes up after an introductory period. Maintenance covers camera cleaning, sensor calibration, and hardware repair. Support plans give you a help desk and set response times, and many vendors include support in the subscription.
Payment processing fees apply to every transaction the system handles. Connectivity means business-grade internet and backup links, because a cashierless store stops selling when the network drops. Add occasional software updates and replacement parts as hardware gets older. Add up these yearly numbers carefully. They go into the ROI formula as part of the cost of investment, and one missed line item makes your result too high.
Quantifying the Benefits
Revenue Gains
You estimate revenue gains by comparing your store's own records before and after deployment. Higher throughput shows up as more transactions per hour during peak periods. Pull your point-of-sale logs and measure the queue time customers currently face. A system that shortens checkout lines lets you serve more shoppers in the same window. Longer selling hours matter if you plan to stay open when staffing a register is impractical. Review your traffic data by hour and identify the periods you currently close or run below capacity.
Basket-size changes require a closer look. Compare average transaction values across matched time periods and customer segments. Reduced walkouts are harder to see directly, so watch for abandoned carts and customers who leave without purchasing. Count these events during a trial period and compare them to your baseline. Each recovered sale adds to the revenue side of your calculation.
Cost Savings
Labor hours redeployed form the largest savings line for most stores. List the hours your team currently spends on register operation, then map where those hours move after installation. Many stores shift staff toward stocking, customer assistance, and floor service. Value the redeployed hours at your actual wage and benefit rates, not at a generic figure.
Shrinkage reduction comes from tighter tracking. Compare inventory variance reports before and after the system goes live. Checkout hardware upkeep also drops when you retire aging registers, so gather your maintenance and replacement invoices from the past year as a baseline. Use your own historical data wherever possible. Industry averages give you a starting point, but your store's records produce a result you can defend.
ROI of Cashierless Store Technology – Scenario 12
Setting Up the Numbers
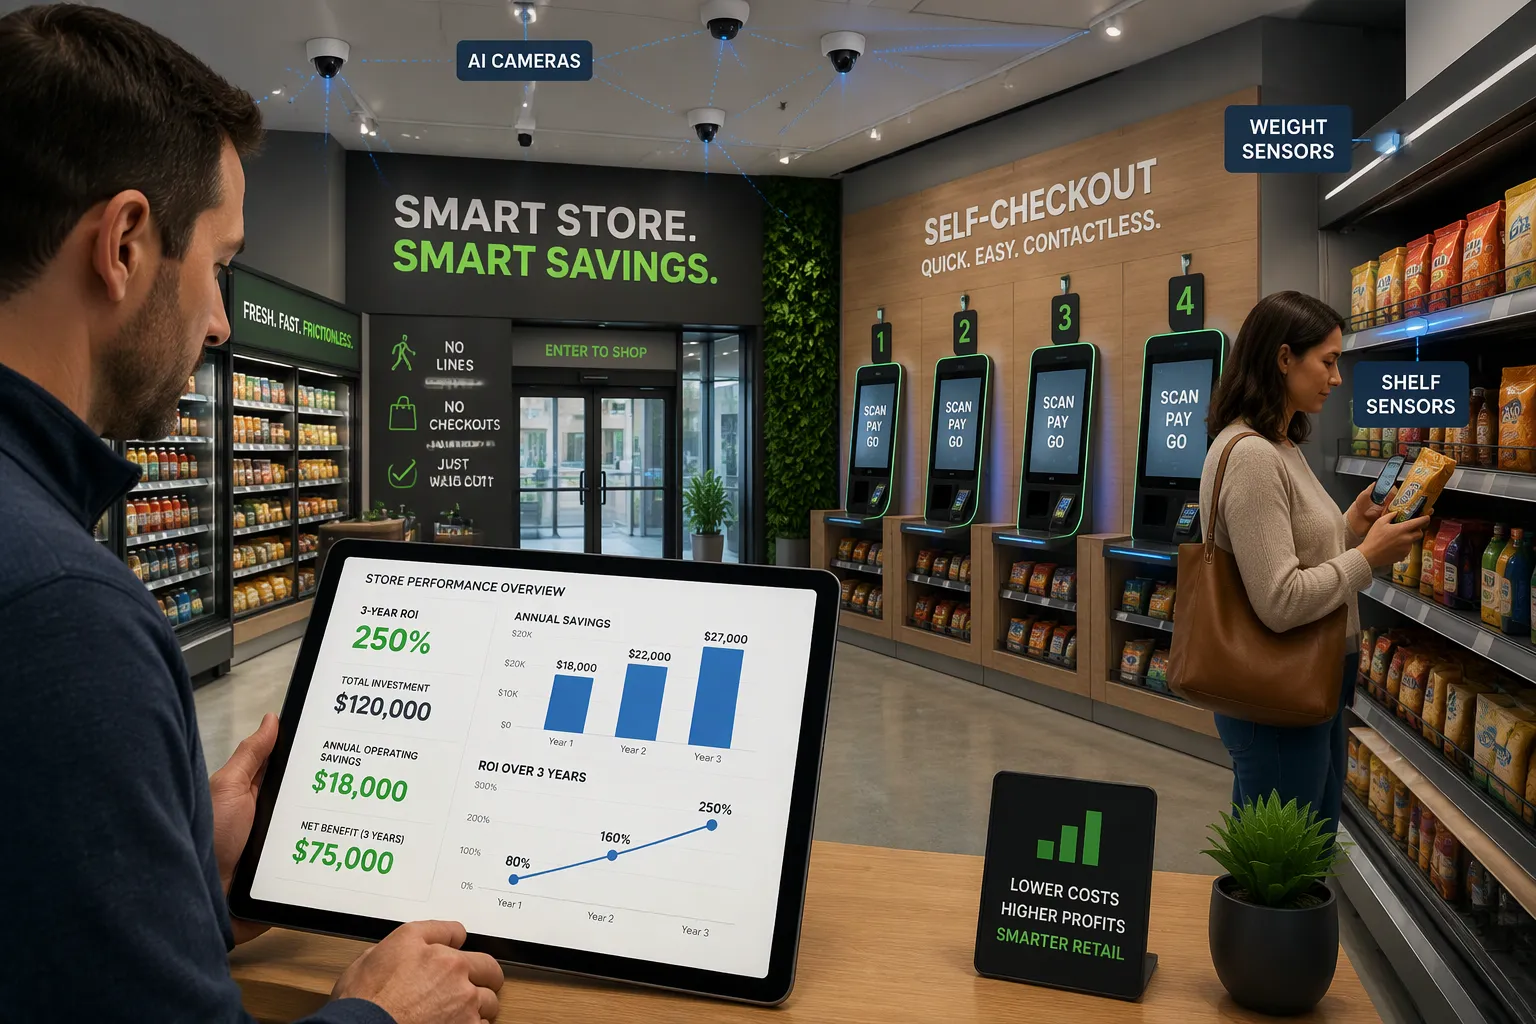
This example uses one store with a single entrance and four checkout lanes. Every figure below is just an example. Treat them as a model for your own math, not as a benchmark for your store.
Line item | Amount |
|---|---|
One-time costs (hardware, software setup, installation, layout changes, training) | $120,000 |
Annual ongoing costs (subscriptions, maintenance, support, payment fees, connectivity) | $18,000 |
Annual benefits (revenue gains plus cost savings) | $75,000 |
The one-time total covers sensors, cameras, kiosks, platform licensing, installation, and staff training hours. The yearly ongoing figure bundles subscriptions, maintenance, support, payment processing, and connectivity. The yearly benefit figure combines higher throughput, longer selling hours, recovered walkout sales, redeployed labor hours, and shrinkage reduction. You build each of these lines from your own records, as the earlier sections describe.
Running the Calculation
Start with net profit from investment. Take the yearly benefits of $75,000 and subtract the yearly ongoing costs of $18,000. That leaves $57,000 in net profit per year. Now subtract the one-time cost of $120,000 to see the full picture across a multi-year horizon.
Year one alone shows a loss: $57,000 minus $120,000 equals negative $63,000. The project turns positive in year two. Over three years, total net profit is $57,000 times three, which equals $171,000, minus the $120,000 one-time cost. That gives $51,000.
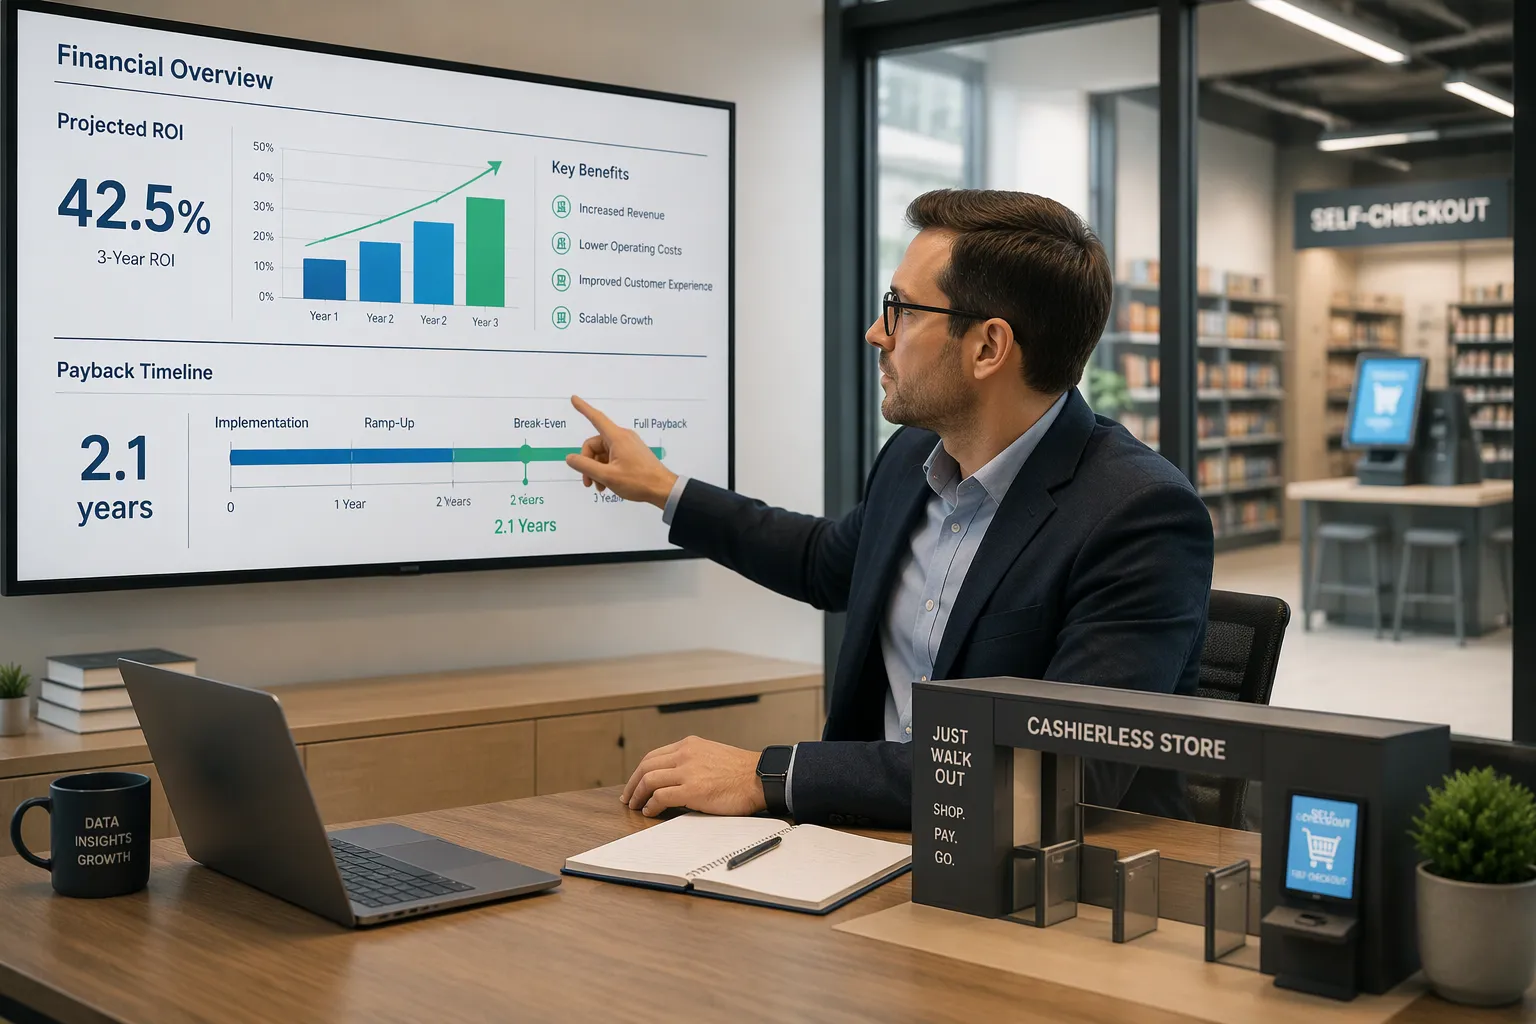
Apply the formula: ROI = (net profit from investment ÷ cost of investment) × 100. Here, 51,000 ÷120,000 × 100 equals 42.5 percent over three years. That result tells you the system returns roughly two-fifths of its total cost in net profit across that window.
Payback period answers a different question: how long until the savings cover the upfront spend? Divide the one-time cost by the yearly net profit. 120,000 ÷57,000 equals about 2.1 years. After that point, the yearly net profit flows to your bottom line.
Run this same walkthrough with your own numbers. Change the yearly benefit to $50,000 and the three-year ROI drops sharply. Raise it to $90,000 and payback shortens. The ROI of cashierless store technology – scenario 12 shows the mechanics, and your data supplies the verdict. A second pass with conservative figures gives you a range instead of a single point. That range is the honest output of the ROI of cashierless store technology – scenario 12 method.
Interpreting Your Results
Reading the Percentage
The percentage you calculate needs context before it means anything. A strong result usually shows net profit that clearly beats the total cost within your planning window. In the ROI of cashierless store technology – scenario 12, the three-year figure of 42.5 percent and a payback near 2.1 years fall in a range many operators would call workable. A marginal result lands close to zero. The system pays for itself, but the gain is thin enough that small changes in costs or benefits could wipe it out. A negative result means the costs outweigh the benefits across the period you measured.
No universal threshold separates these bands. A small store with tight cash flow may need a higher percentage than a large chain that can handle a longer payback. Compare your result against your own cost of capital and against other projects competing for the same budget. Run the calculation across several horizons, because a one-year view and a five-year view tell different stories. The same system can look weak in year one and strong by year three.
Strategic Factors to Weigh
The number is one input, not the whole decision. Several factors sit outside the formula, and you should weigh each one openly.
Customer experience: shorter lines and faster checkout can boost satisfaction and repeat visits. These gains are hard to price, but they shape long-term revenue.
Competitive positioning: early adoption can set your store apart in a local market. Think about how long that advantage lasts as rivals catch up.
Scalability: a system proven in one store may lower costs per location as you add more sites. Ask vendors how pricing changes at volume.
Phased rollout: you can deploy in one department or during peak hours first. A smaller pilot lowers the upfront cost and lets you test the benefit estimates before a full commitment.
Weigh these factors against the percentage. A modest ROI with a strong experience gain may still justify the spend. A high ROI with no path to scale may not. Write down your reasoning beside the numbers, so your team sees why you chose to proceed or wait. That record turns a single calculation into a repeatable decision process, and it keeps your savings strategy honest as conditions change.
You now have a process you can repeat. Write down every cost, both one-time and ongoing. Measure every benefit using your own store records. Use the formula: net profit from investment divided by cost of investment, times 100.
Careful ROI analysis is the foundation of a smart investment in cashierless technology.
The ROI of cashierless store technology – scenario 12 shows how the math works, and your data gives the final answer. Collect your store's numbers this week. Run the calculation, try a conservative case, and let the percentage guide your next step.
FAQ
How do you handle benefit estimates you cannot confirm?
Start with careful, low numbers. Use your own sales records and inventory reports as the starting point. Run the math twice, once with cautious numbers and once with hopeful ones. The space between the two results shows your risk range. A project that still comes out positive in the cautious case is worth a closer look.
How often should you rerun the calculation?
Rerun it anytime a big input changes. A new subscription price, a change in traffic patterns, or a revised labor plan all shift the result. Check the numbers at least once a year after launch. Compare real results against your first estimates and update your assumptions.
Should you test a pilot store before a full rollout?
A pilot lowers your upfront risk and tests your benefit estimates in real conditions. Start in one department or during peak hours first. Measure throughput, walkouts, and labor hours against your baseline. Put the pilot data back into the formula before you commit to more locations.
What should you do when the result comes back negative?
Do not drop the project based on one number. Renegotiate vendor pricing, shrink the scope, or phase the rollout to cut the upfront cost. Recheck your benefit estimates for savings you missed. A negative result often points to an input you can fix, not a dead end.
Does store size change the outcome?
Yes. Larger stores spread fixed costs like software setup and installation across more transactions. Smaller stores carry the same setup burden on thinner volume. Scale pricing and phased deployment options matter most for small footprints. Model your own square footage and traffic rather than borrowing another store's result.
See Also
Cloudpick Delivers Seamless Cashierless Shopping Experience For Your Retail Store
Artificial Intelligence Powered Retail Stores Represent The Future Of Shopping
Smart Electronic Vending Machines Are Transforming Retail Through Advanced Technology Solutions
Comparing Micromarkets And Smart Stores In Global Automated Convenience Retail Operations
Examining Walgreens Self Checkout Systems Benefits And Challenges In Modern Retail
