Understanding and Optimizing the Modern Shopping Journey

Imagine you walk into a store, browse online, and receive a personalized offer—all in one shopping journey. Today, 61% of shoppers value the in-store experience, but 21% say that online purchases come from in-store interactions. The Modern Shopping Journey blends digital and physical touchpoints, making it challenging to track every step. You need to map each interaction to improve the experience and drive results. Data analytics and technology play a big role. Companies using real-time analytics see up to 20% better marketing ROI.
Personalization and AI help you predict needs and customize each journey, leading to higher satisfaction and revenue growth.
Statistic Description | Numerical Value / Percentage |
|---|---|
Online purchases influenced by in-store interactions | 21% |
Shoppers valuing in-store experience | 61% |
Retailers advancing unified commerce initiatives in 2025 | 38% |
Fulfillment cost reduction with mature unified commerce | 27% lower |
Cart abandonment rate reduction with mature unified commerce | 18% lower |
Gen Z share of global population | 25% |
Gen Z projected spending power by 2030 | $12 trillion |
Baby Boomers' share of U.S. wealth | 51% |
Baby Boomers' annual outspending over other generations | $400 billion |
Key Takeaways
The modern shopping journey mixes online and in-store experiences, making it important to track every customer interaction.
Mapping the customer journey helps find problems and improve each step, leading to higher satisfaction and more sales.
Using technology like AI and data analytics allows businesses to personalize shopping and fix issues faster.
Optimizing mobile experience and content makes shopping easier and keeps customers engaged.
Measuring key metrics like conversion rates and customer satisfaction guides better decisions and long-term growth.
Modern Shopping Journey

Definition
You experience the modern shopping journey every time you interact with a brand across different channels. This journey blends online and offline experiences, making it unique for each shopper. In today’s world, you might start by seeing a product on social media, check reviews on an ecommerce site, visit a physical store, and finally make a purchase through a mobile app. The modern shopping journey is not linear. You move between touchpoints based on convenience, preference, and need.
Advanced data analytics help brands predict your purchasing patterns and personalize your experience.
Ecommerce platforms use AI, VR, and AR to create immersive and engaging shopping journeys.
Social media and influencer marketing shape your decisions by offering authentic content and peer recommendations.
You expect brands to align with your values, such as sustainability and ethical practices.
Local culture and personal preferences influence your choices, even in a global ecommerce market.
NielsenIQ’s research shows that Gen Z shoppers demand seamless omnichannel experiences. They want brands to use data to personalize offers and show transparency. Salsify’s 2024 report finds that almost half of consumers prefer a mix of online and in-store shopping, highlighting the importance of a connected journey.
Why It Matters
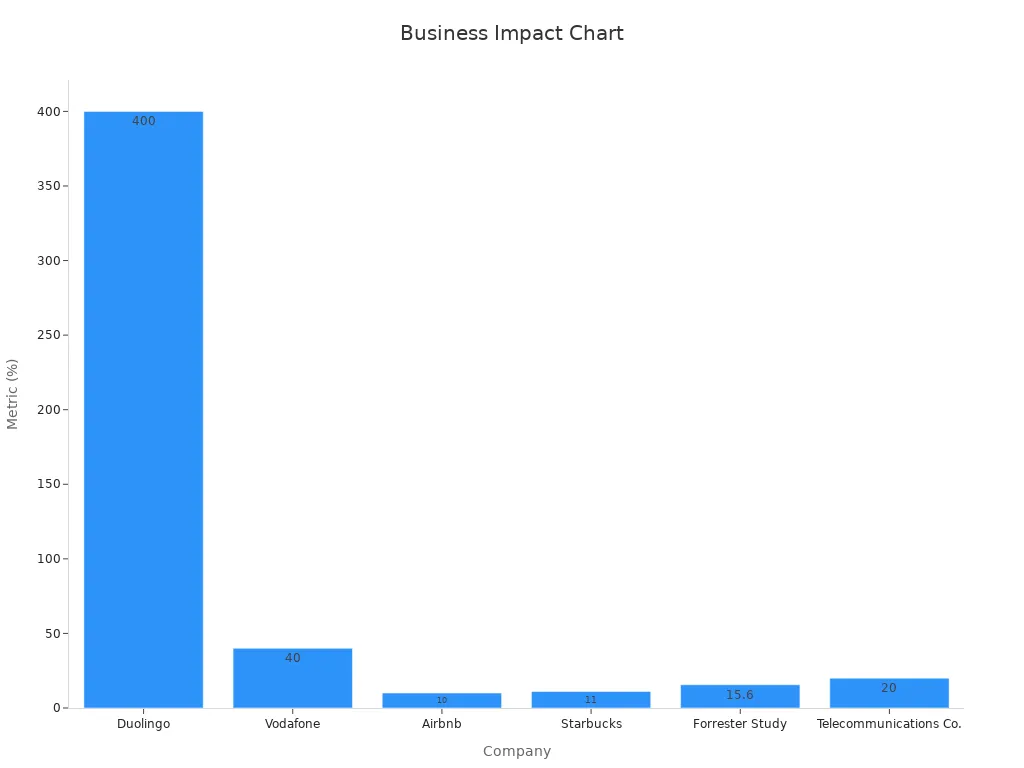
Understanding the modern shopping journey helps you improve customer satisfaction and drive business growth. When you map each stage of the journey, you can identify pain points and optimize every interaction. Companies that focus on journey analytics see real results:
Company/Source | Metric/Result | Impact Description |
|---|---|---|
Duolingo | Focused on user retention and journey mapping | |
Vodafone | 40% reduction in customer churn | Improved journey analytics |
Airbnb | 10% increase in bookings | Optimized booking journey |
Starbucks | 11% increase in loyalty members | Enhanced journey analytics |
Forrester Study | 15.6% increase in marketing ROI | Used advanced journey analytics tools |
Tip: When you understand emotions and motivations at each stage, you can boost conversions and build loyalty. For example, one healthcare provider increased bookings by 156% after mapping emotional touchpoints in their journey.
The modern shopping journey shapes how you shop, what you value, and how brands connect with you. Ecommerce businesses that adapt to these trends will stay ahead in a fast-changing market.
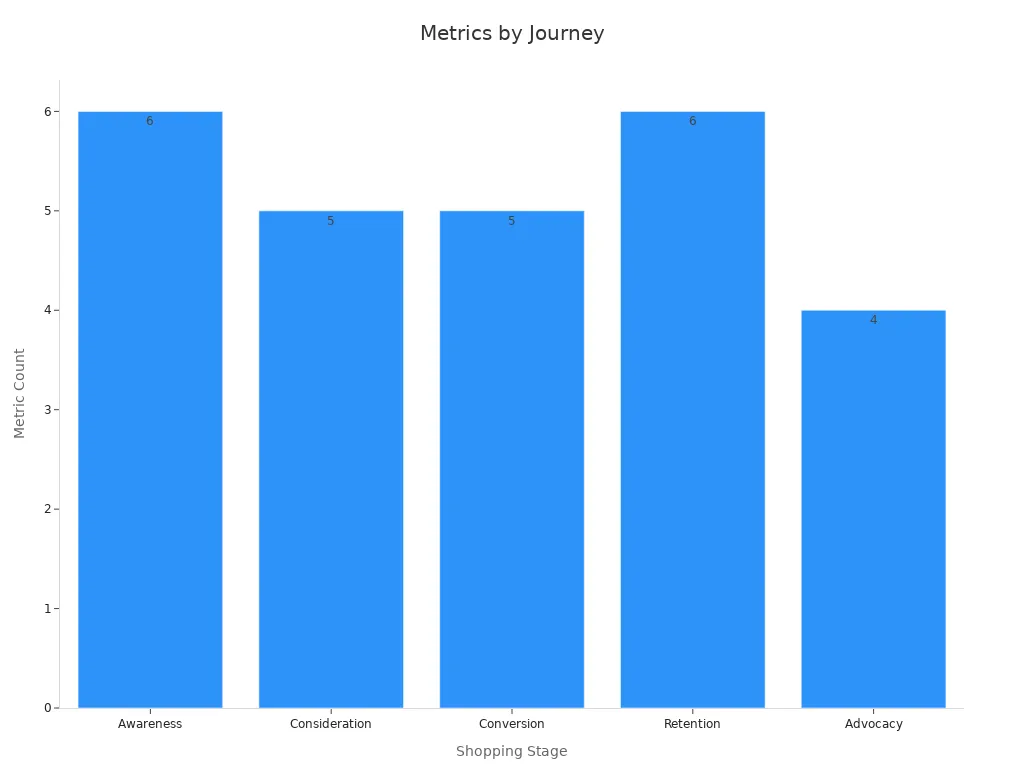
Key Stages
The customer journey shapes every step of the consumer purchase journey. You move through several stages, each with unique behaviors and needs. Understanding these stages helps you create positive experiences and improve customer retention.
Awareness
You start the customer journey by discovering a brand or product. Social media ads, referrals, and online content often spark your interest. Brands use personalized marketing and lead capture strategies, such as discounts or loyalty points, to grab your attention.
73% of consumers use multiple channels during this stage, showing the importance of an omnichannel approach.
87% of retailers report higher sales and marketing ROI when they map the customer journey from the start.
Shopping Journey Stage | |
|---|---|
Awareness | Website visits, SEO ranking, Social media engagement, Video views, Newsletter subscriptions, Conversion rate |
Consideration
In the consideration stage, you compare options and gather information. Brands help you by offering product reviews, dynamic recommendations, and AI chatbots. Automation, retargeting ads, and behavior-triggered emails guide your decision-making.
Segmenting the consumer purchase journey at this stage allows brands to tailor messages and improve relevance.
Clicks, open rates, and engagement metrics help measure your interest.
Shopping Journey Stage | Commonly Used Metrics |
|---|---|
Consideration | Clicks, CTR, Open rate, Engagement, CPC |
Purchase
You reach the acquisition stage when you decide to buy. A seamless checkout process and trusted payment methods, like Shop Pay, make the experience smooth.
Trusted payment options increase repeat purchases by 77%.
Personalized experiences at this point can lead to 140% higher spending.
Shopping Journey Stage | Commonly Used Metrics |
|---|---|
Conversion | Leads, Conversion rate, Sales, CPL, Cost per conversion |
Post-purchase
After the purchase, your experience continues. Brands focus on customer service and engagement to build relationships.
Multi-channel support, including live chat and AI, resolves issues 30% faster.
Journey mapping reduces customer service costs by up to 20%.
Shopping Journey Stage | Commonly Used Metrics |
|---|---|
Retention | Customer loyalty, Net Promoter Score®, Customer satisfaction, User feedback, Customer support tickets, Customer lifetime value |
Loyalty
The loyalty stage is where you become a repeat buyer and advocate. Brands encourage reviews, referrals, and loyalty programs.
Loyal customers make up 21% of the audience but drive 44% of revenue.
59% of orders come from repeat buyers, showing the power of customer loyalty.
Shopping Journey Stage | Commonly Used Metrics |
|---|---|
Advocacy | Referrals, Customer reviews, Guest posts, Influencers |
Note: Mapping the retail customer journey across all stages leads to faster issue resolution, higher customer retention, and increased revenue.
The buyer’s journey is not always linear. You may revisit stages or use different channels. By understanding the customer journey, you help create positive experiences and build lasting customer loyalty.
Journey Mapping

Mapping the customer journey helps you see every step your customers take. You can spot where they interact with your brand, what problems they face, and which tools help you improve their experience. When you map both digital and physical touchpoints, you get a full picture of how customers move from awareness to loyalty. This process lets you find gaps, fix issues, and create a seamless journey.
Touchpoints
Touchpoints are all the places where customers connect with your brand. These can be online or offline. You might visit a website, see a social media ad, walk into a store, or call customer support. Each touchpoint shapes how you feel about the brand.
Website visits, social media, and email are common digital touchpoints.
In-store visits, support calls, and events are physical touchpoints.
Some touchpoints happen behind the scenes, like order processing or delivery updates.
Mapping every touchpoint matters. A case study from SoFi found a technical error that caused 28,000 abandoned sessions each year, costing $9 million in lost revenue. By mapping the customer journey, SoFi fixed the problem and saved money. Salesforce research shows that 67% of senior marketing leaders see connected customer journeys as critical, but only 23% feel satisfied with their data use. Forrester reports that about 70% of brands do not meet customer expectations, often because they miss key touchpoints.
Tip: List both digital and physical touchpoints to make sure you do not overlook any part of the customer journey.
Pain Points
Pain points are the problems or frustrations customers face during their journey. You need to find these issues to improve the experience and keep customers happy.
Survey customers and talk to your support team to uncover real pain points.
Use data analytics to see where customers drop off or get stuck.
Track metrics like cart abandonment rates, which can reach 70% online.
When you map pain points, you can fix them faster. For example, if many customers leave during checkout, you might need to simplify the process or add more payment options. Regularly update your journey maps after product changes to catch new issues early. Involving cross-functional teams helps you see pain points from different angles.
Note: Analyzing pain points leads to higher satisfaction, more spending, and better retention.
Tools
You have many tools to help with customer journey mapping. These tools collect data, analyze customer interactions, and show you where to improve.
Tool Type | Example Uses |
|---|---|
Analytics Platforms | Track website visits, conversion rates, and ROI |
AI and Machine Learning | Find hidden patterns, predict behavior, personalize journeys |
Surveys and Feedback | Gather direct input from customers |
Social Listening Tools | Monitor brand mentions and customer sentiment |
Journey Mapping Software | Visualize the entire customer journey |
AI and data analytics make customer journey mapping faster and smarter. Traditional mapping can take weeks, but AI processes large data sets in real time. AI helps you spot hidden patterns, predict what customers need, and personalize their journey. About 50% of sales professionals say AI makes journey mapping scalable. Companies using AI-driven customer journey mapping see a 25% increase in satisfaction and a 15% boost in loyalty. Amazon’s AI-powered recommendations drive 35% of its sales. Walmart’s AI chatbots cut support queries by 25% and raised satisfaction by 15%.
Callout: Use AI and analytics to keep your journey maps up to date and responsive to customer needs.
Best practices for customer journey mapping include:
Identify buyer personas to understand customer goals and frustrations.
Define each step in the journey, from pre-purchase to post-purchase.
List all touchpoints, both digital and physical.
Track data like demographics, purchase history, and communication preferences.
Use A/B testing, interviews, and analytics to learn more about customer behavior.
Share journey maps with your team to align everyone’s efforts.
Update maps regularly to reflect changes and new insights.
Customer journey analytics help you measure the impact of your efforts. By tracking key performance indicators like conversion rate and ROI, you can see how changes improve revenue and customer lifetime value. Marketo found that real-time, data-driven decisions can boost conversion rates by 20%. Omnichannel integration also increases retention rates by 25%, according to Gartner.
Remember: Customer journey mapping is not a one-time task. Keep refining your maps as you learn more about your customers.
Customer Journey Optimization
Optimizing the customer journey helps you turn every interaction into an opportunity for growth. You can use technology, AI, and data to improve each stage of the consumer purchase journey. When you focus on customer journey optimization, you remove friction, boost engagement, and increase loyalty. Companies that use real-time analytics and continuous refinement see higher conversion rates and better customer experience optimization. The table below shows how different industries benefit from customer journey optimization:
Industry | Company | Measurable Impact on Sales Performance and Related Metrics |
|---|---|---|
Finance | SoFi | Prevented up to $9 million in potential revenue losses; increased conversion rates |
Retail | Chemist Warehouse | Achieved a 9% increase in conversion rates |
Telecommunications | U.S. Telecom | Saved over $500,000 annually by fixing checkout promo code errors |
Travel & Hospitality | Marriott | Reduced support requests by 60%, improving customer access and satisfaction |
Insurance | An Post Insurance | Increased conversion rates by 6%; reduced call center inquiries |
According to McKinsey, companies that use customer journey analytics see a 10–15% increase in revenue and a 15–20% reduction in service costs. These results come from reducing friction, increasing conversion rates, and improving satisfaction and loyalty. Customer journey optimization turns your business into a growth engine.
Personalization
Personalization lets you tailor the customer journey for each person. You can use data to segment your audience and deliver messages that match their needs. AI and machine learning help you analyze customer behavior and create dynamic content. When you personalize the ecommerce customer journey, you make every touchpoint more meaningful.
82% of consumers say personalized experiences influence their brand choice in at least half of shopping situations.
61% of consumers will spend more with companies that customize their service.
Companies that use personalization strategies generate 40% more revenue than those that do not.
Personalization leads to higher satisfaction, loyalty, and better brand reputation.
You can gather customer data, define buyer personas, and use AI to deliver real-time recommendations. This approach helps you create a seamless experience and increase engagement. Personalization also helps you stand out in a crowded ecommerce market.
Mobile Experience
Mobile optimization is key to customer journey optimization. Most shoppers use smartphones to browse, compare, and buy products. You need to make sure your site and apps work well on all devices. Fast loading times, easy navigation, and secure mobile checkout improve the customer journey.
Statistic Description | Percentage / Figure | Explanation |
|---|---|---|
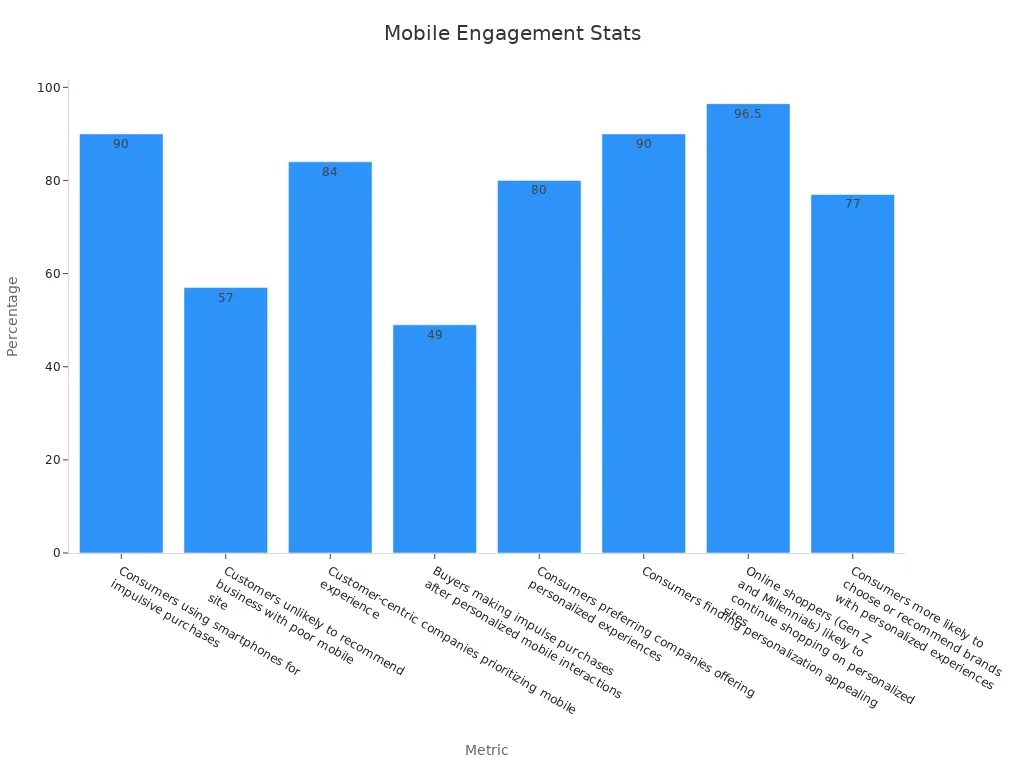
Consumers using smartphones for impulsive purchases | Nearly 90% | Mobile devices strongly influence spontaneous buying decisions |
Customers unlikely to recommend business with poor mobile site | 57% | Poor mobile experience harms customer loyalty and engagement |
Customer-centric companies prioritizing mobile experience | 84% | Shows business focus on mobile optimization to improve engagement |
Buyers making impulse purchases after personalized mobile interactions | 49% | Personalized mobile experiences increase immediate purchases |
Consumers preferring companies offering personalized experiences | About 80% | Personalization on mobile drives customer preference |
Consumers finding personalization appealing | 90% | Indicates strong consumer desire for tailored mobile experiences |
Online shoppers (Gen Z and Millennials) likely to continue shopping on personalized sites | 96%-97% | Personalization retains younger, mobile-savvy shoppers |
Consumers more likely to choose or recommend brands with personalized experiences | 77% | Personalization enhances brand loyalty and engagement |
Nearly 80% of shoppers use smartphones in-store to visit retailer websites. About 74% use retailer apps while shopping. If your mobile site is slow or hard to use, 57% of customers will not recommend your business. Mobile optimization supports a seamless experience and drives customer engagement.
Content Optimization
Content optimization shapes how customers move through the customer journey. You need to create content that matches each stage of the consumer purchase journey. Use clear product information, fast-loading pages, and engaging stories to guide customers from awareness to loyalty.
Content Optimization Strategy | Description & Impact on Conversion Rates |
|---|---|
User Experience Improvements | Fast-loading sites, clear product info, and removal of distractions create smooth customer journeys, increasing conversion likelihood. |
High-Quality, Audience-Relevant Content | Creating educational and engaging content tailored to audience interests boosts traffic and encourages deeper site exploration, aiding conversions. |
Audience Research & Segmentation | Personalizing content based on customer characteristics enhances engagement and conversion by targeting specific sales funnel stages. |
A/B Testing & Experimentation | Testing different content versions identifies the most effective elements, directly improving conversion rates. |
Personalized Email Marketing | Customized emails based on segmentation increase open rates and foster stronger customer-business relationships, driving conversions. |
Influencer Endorsements | Leveraging trusted influencers expands reach and credibility, resulting in increased sales and conversions. |
AI Tools & Future Trends | AI-powered tools optimize content delivery and ad targeting, enhancing conversion optimization efforts. |
You can use A/B testing to find the best headlines, images, and calls to action. Segment your audience and send personalized emails to boost open rates. AI tools help you deliver the right content at the right time. Content optimization increases conversion rates and supports customer journey optimization.
Accessibility
Accessibility ensures everyone can enjoy your customer journey, including people with disabilities. You need to design your website and apps so all customers can use them. Add alt text to images, use readable fonts, and make navigation simple. Accessibility is not just about compliance; it improves the overall customer experience.
Marriott reduced support requests by 60% after improving accessibility. This change made it easier for customers to get help and increased satisfaction. When you focus on accessibility, you remove barriers and create a seamless experience for every customer.
Tip: Regularly test your site for accessibility issues. Use feedback from customers to find and fix problems quickly.
Customer journey optimization is an ongoing process. You need to segment your customers, define buyer personas, and use technology to refine every stage. When you focus on optimization, you increase engagement, loyalty, and revenue. Ecommerce brands that invest in customer journey optimization lead the market and build lasting relationships.
Measuring Success
Metrics
You need to measure the right metrics to know if your customer journey optimization works. Tracking these numbers helps you see what works and what needs improvement. The best metrics give you a clear view of customer satisfaction and business growth.
Customer lifetime value tells you how much a customer spends over time.
Retention rate measures how many customers return.
Churn rate tracks how many customers stop buying.
Customer acquisition cost shows how much you spend to get a new customer.
Net Promoter Score (NPS) tells you how likely customers are to recommend your brand.
Reviews and ratings reveal how customers feel about their experience.
You should track these metrics at each stage of the customer journey. For example, use website visits and email open rates in the awareness stage. In the loyalty stage, focus on NPS and repeat purchases. Combining tactical metrics with strategic KPIs gives you a full picture. Regularly review and adjust your KPIs to match your business goals. This approach helps you improve customer satisfaction, retention, and revenue.
Tip: Use both leading indicators (like engagement) and lagging indicators (like revenue) for a complete view of your customer journey.
Overcoming Challenges
Measuring the success of your customer journey can be hard. Many businesses face data overload or focus on the wrong numbers. Sometimes, teams lack resources or only look at short-term ROI. These problems can hide real issues in customer satisfaction.
A PWC survey found that one-third of customers leave a brand after just one bad experience. High-quality experiences matter. Deloitte research shows that happy customers are 2.7 times more likely to keep buying and may pay up to 16% more for a better journey.
To overcome these challenges:
Focus on meaningful metrics like customer satisfaction, churn rate, NPS, and customer lifetime value.
Bring data together from all departments for a clear view of the customer journey.
Collect feedback at every stage using surveys and interviews.
Use tools like CRM systems and analytics platforms to track accurate data.
Start small if resources are limited, and grow your efforts over time.
Note: Avoid looking only at quick wins. Think about long-term satisfaction and loyalty. Direct feedback helps you understand what customers need and where to improve.
Actionable Tips
Quick Wins
You can achieve fast results in customer journey optimization by focusing on small, high-impact changes. Start by listening to your customer. Use surveys, feedback, and analytics to spot pain points. Prioritize the issues that affect the most customers or have the biggest impact on your business. Companies like Amazon use data-driven personalization to quickly improve the customer journey. You can do the same by acting on actionable insights.
72% of customers expect immediate service. Adding chatbots or improving response times on social media can make a big difference. These quick-win tactics help you meet customer needs right away.
Use DX3 metrics to guide your efforts:
DX3 Metric | Description | Impact on Business Outcomes |
|---|---|---|
Emotion | Measures how the customer feels about your brand | Positive feelings drive loyalty and repeat visits |
Effort | Measures how easy it is for the customer to interact | Lower effort can increase spend by up to 23% |
Success | Measures if the customer completes their goal | Completion alone is not enough; focus on emotion and effort |
Focus on reducing effort and improving emotional connections. These steps lead to immediate improvements in customer journey optimization.
Long-term Strategy
For lasting success, you need a long-term approach to customer journey optimization. Lifecycle marketing models help you keep customers engaged beyond the first purchase. These models focus on retention, upselling, and advocacy, which increase customer lifetime value. Hybrid strategies combine the speed of sales funnels with the depth of lifecycle models.
Customer journey mapping and strategic planning help you find friction points. Real-world examples show that companies who optimize onboarding, personalize experiences, and create engagement loops see big gains. For example, Airbnb improved booking rates by testing different ways to encourage profile photo uploads. Netflix increased engagement by refining how it presents personalized recommendations.
KPI | Before | After | Improvement (%) |
|---|---|---|---|
Online Conversion Rate | 8.05% | ~15% | |
Customer Onboarding Time | 10 days | 6.5 days | ~35% |
Average Customer Lifetime Value | $500 | $650 | 30% |
AI-driven insights and real-time data help you segment customers and predict needs. This ongoing optimization ensures your customer journey stays effective as trends change. Align your marketing and sales teams with customer data to keep improving every touchpoint.
Tip: Regularly test and refine your strategies. Continuous customer journey optimization builds loyalty and drives long-term growth.
You gain real results when you focus on the customer journey. Mapping each customer interaction helps you deliver positive experiences and build loyalty. Research shows that:
63% of marketers work with sales teams to create customer journey maps.
83% say journey maps improve job performance.
Retaining a customer costs up to five times less than finding a new one.
Consistent customer experiences boost loyalty by 25%.
Start mapping your customer journey today. Use data to guide every decision. When you put the customer first, you create lasting value and drive growth.
FAQ
What is a customer journey map?
A customer journey map shows each step you take when you interact with a brand. You can see where you start, what you do next, and how you feel at each stage. This helps you understand your experience.
Why should you optimize the shopping journey?
You should optimize the shopping journey to make shopping easier and more enjoyable. When you improve each step, you help customers find what they need. This leads to higher sales and stronger loyalty.
How does technology help improve the shopping journey?
Technology helps you track customer actions, gather feedback, and personalize offers. You can use tools like AI, analytics, and chatbots. These tools help you fix problems quickly and create a better experience.
What are common pain points in the shopping journey?
You may face slow websites, confusing checkout steps, or poor customer service. These pain points can make you leave before buying. Brands need to find and fix these issues to keep you happy.
How can you measure the success of your customer journey?
You can measure success by tracking key metrics. Look at conversion rates, customer satisfaction scores, and repeat purchases. Use surveys and reviews to get feedback. This helps you see what works and what needs improvement.