How AI-Powered Spatial Intelligence Boosts On-Shelf Availability and Cuts Revenue Leakage

A product can show as fully in stock in the inventory system while the shelf in front of the shopper stays empty. That gap in on-shelf availability costs sales. IHL Group linked 10.3% of total retail sales to inventory distortion in 2020, and out-of-stocks alone make up a large share of the loss. Shoppers do not see records. They see empty facings, and they walk away.
Spatial intelligence changes that picture. It runs on cameras stores already own and turns shelf reality into a steady signal tied to revenue. Retail operations leaders can then see what the customer sees, act fast, and measure recovered revenue. How do they close the gap between record and reality, and prove the gain?
Key Takeaways
Inventory records often show stock that shoppers cannot find on the shelf, which leads to lost sales.
AI uses cameras already in stores to watch shelves all day. It flags empty spots right away.
Order shelf problems by how much money they cost. This way, teams fix the most costly gaps first.
Watch how shoppers react to empty shelves to measure lost revenue and improve your response.
Swap out regular audits for constant shelf monitoring to keep products in stock and win back revenue.
On-Shelf Availability as a Revenue Signal
The Inventory-Shelf Gap
Retail teams often treat on-shelf availability as a compliance score. But the real question is simpler: can the customer buy the item right now? A shelf can pass an audit and still fail the shopper.
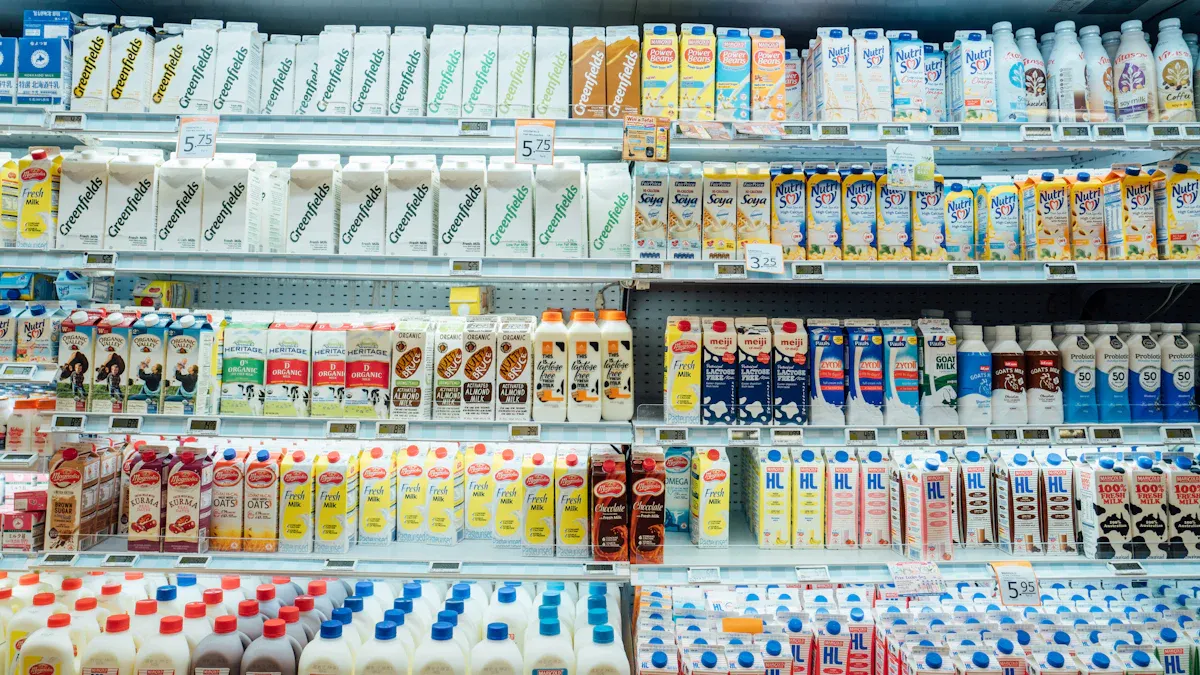
The gap has several causes. Empty facings show up while stock sits in the backroom. Items end up in the wrong spot after a reset. Promotional displays block the products behind them. Planograms describe an ideal layout, but they don't account for changing store conditions. Local fixture changes, vendor-managed categories, and manual "off system" handling all widen the distance between the record and the shelf.
Phantom inventory drives much of the problem. The system tracks deliveries, sales, and manual adjustments, but it never checks the shelf. The result is phantom stockouts: the record shows stock that no shopper can find.
Impact Dimension | Evidence |
|---|---|
Out-of-stock causation | Up to 70% of undetected out-of-stock events come from phantom inventory, not supply shortages |
Revenue loss | Retailers lose up to $1 trillion annually to phantom inventory-driven out-of-stocks worldwide |
Customer switching | Nearly 70% of shoppers who hit an out-of-stock switch brands or leave the store |
Replenishment failure | Phantom inventory suppresses orders for out-of-stock items in up to 30% of cases |
SKU prevalence | Inventory inaccuracy affects up to 65% of retail SKUs at any given time |
The Cost of a Missing Item
A missing item rarely leads to a clean zero sale. Shoppers pick something else, and the substitute often has a lower margin. Some baskets get smaller. Some trips end at a competitor. Each outcome drains revenue that the inventory record never flags as lost.
The damage adds up. Stock stuck in the backroom hides demand from inventory and replenishment systems, so orders stay suppressed and the gap continues. Poor inventory availability also skews retail analytics: sales data misreads demand, and category decisions follow bad signals. One retail executive described the human cost plainly:
"If something is not delivered, then customers can get very upset and that results in significantly lower customer lifetime value and that impacts revenue," said Mitrofanov.
That is the leakage case for treating shelf availability as a revenue signal rather than a compliance box.
AI in Retail Operations for Shelf Visibility
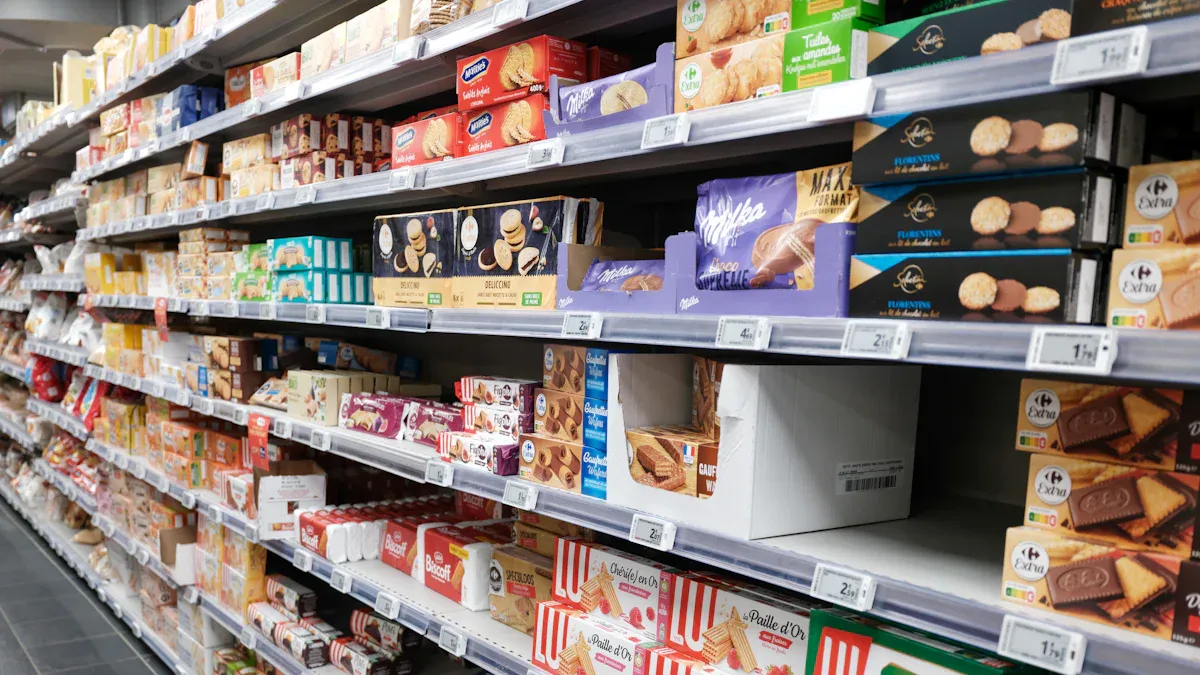
Old-fashioned shelf checks need extra workers or special shelf sensors. Both add cost and complexity, and both limit how far a program can grow. Manual audits also check a store only at set times, so the shelf goes unobserved between visits. AI in retail operations removes that limit by turning the camera setup already in place into a continuous measuring tool.
Using Existing Cameras
The AiFi platform uses computer vision and spatial intelligence on existing camera systems. It reads product positioning and depletion in real time, with no new hardware. General retail surveillance cameras already give shelf-level observation, and modern units deliver ultra-clear footage up to 20MP with wide dynamic range and smart infrared for backlit, low-light, or reflective conditions. Connected shelf-edge cameras add a closer view and trigger automated tasks when they detect empty spaces or low stock. High-resolution imaging, with AI reconstruction, supports precise shelf analysis, and on-device processing cuts WiFi data transfer by up to 60%.
For AI in retail operations, this approach gives teams a continuous view from the shopper's perspective. The platform detects empty facings, misplaced products, and deviations from the agreed layout. Shelf object-detection models spot pricing errors and planogram violations with accuracy comparable to trained merchandising teams, at a fraction of the cost. AI-powered shelf monitoring has been reported to cut out-of-stock incidents by as much as 30% compared with conventional manual audits. Standardized image capture raised detection precision by 28% in the first 30 days, and retraining cut false positives from 18% to 4%.
Real-Time Availability Signals
Computer vision handles each detection task with a defined method. The table below sums up the core ones.
Detection task | How computer vision handles it | Key challenge |
|---|---|---|
Facing count and share of shelf | Counts visible units using bounding-box metadata and SKU tags | Consistent annotation across thousands of photos |
Price tag and label recognition | OCR verifies tags and flags pricing discrepancies | Damaged labels and lighting variance |
SKU-level classification | Hierarchical labels separate brand, line, SKU, and variant | Many color and size variants |
Occlusion and clutter | Polygon annotations flag partially visible products | Overlapping or hidden items |
The workflow runs in a clear order. A camera captures the bay, software reads the shelf, and the system compares the result against product data and the planogram. Findings become a prioritized queue ranked by aisle, fixture, and severity, with a full void on a high-velocity SKU ahead of a single facing short. Staff fix the shelf and confirm with a photo, so retail execution ends in a fixed shelf rather than a dashboard. If the shelf and backstock are both empty, the issue moves to inventory or ordering workflows.
Frequency matters here. Handheld tablets with computer vision let store teams count inventory 8x more often, which speeds replenishment and lifts product availability. That cadence turns on-shelf availability into a live signal and gives retail analytics a current picture of real-time shelf levels. The same data feeds retail operational analytics, where teams track leakage as observed behavior rather than inference. AI and data analytics then link shelf state to shopper response, and retail operations gain a feedback loop that supports real-time inventory decisions across the estate. Retail operational analytics also show which stores respond fastest, so AI in retail operations spreads proven practice rather than guesswork.
From Visibility to an Actionable Queue
Spotting a problem is not the same as getting money back. The platform does not hand managers one more dashboard to figure out. Instead, it gives them a ranked list of the availability problems that cost the most. Each one is tied to a certain aisle and shelf spot and sorted by dollar impact. Every item also comes with a confidence signal, so teams know how sure the detection is before they send someone to fix it.
Prioritizing Revenue Leakage
For a long time, retail teams used their own judgment to pick which availability gaps to fix first. A revenue-impact approach ranks problems on its own by dollar impact, so the biggest losses show up first. The platform measures lost sales by comparing unconstrained demand, what POS could have shown, with actual sales. Every empty shelf then gets a dollar figure.
Approach | How shelf availability issues are prioritized |
|---|---|
Traditional / manual | Relies on manual judgment to decide which availability gaps to address |
Revenue-impact driven | Issues are ranked automatically by their dollar impact, so the biggest revenue losses surface first |
Not every product brings in the same revenue. Retailers should protect top-selling items, high-margin products, and hero SKUs first. This focus makes sure revenue-critical products get attention before lower-impact items. A real dollar figure and store-level detail turn a complaint into a talk about making more revenue. Key metrics guide this work: on-shelf availability, out-of-stock rate, sell-through rate, inventory turnover, sales per square foot, and markdown percentage. On-shelf availability, for example, equals SKUs available on shelf divided by total listed SKUs, times 100. Backroom stock does not count.
Linking Shelf to Shopper Behavior
The platform follows shopper movement and behavior to measure leakage as something seen, not guessed. The sequence can be watched. A shopper arrives expecting a certain product. The shopper stops and searches. The shopper checks nearby shelves. Then comes a choice: substitute, or leave without buying, or drop the whole basket.
A shopper arrives at a location expecting a specific product.
The shopper pauses and begins searching for the item.
The shopper scans adjacent shelves to locate it.
The shopper then makes a decision, sometimes substituting another product.
Sometimes the shopper leaves without purchasing.
Sometimes the shopper abandons the basket entirely.
These behaviors, tied to on-shelf conditions, form a sequence you can watch, and retail operations can use it to measure revenue leakage from availability gaps. Dwell time by itself is a weak proxy, since longer dwell often means friction. Attention-to-pickup, attention-to-basket, and decision latency link observed behavior straight to conversion and measurable ROI. Up to 60% of purchase decisions are made in-store, and eye-level products can sell 20–25% more than lower-shelf items. Poor visibility creates silent revenue leakage even when demand is strong.
Digital shelf analytics surfaces weak points such as sudden availability drops and declining rankings; monitoring dashboards let teams act before revenue leakage accelerates.
The queue closes the loop between detection and retail execution. Each fix is confirmed, and the shelf returns to a sellable state.
Retail Operational Analytics That Measure Change
Metrics Beyond Compliance
Compliance scores tell a team whether a shelf matched the plan at audit time. They say little about revenue. Retail operational analytics shift the focus to measures that track money and shopper experience together.
Metric | What it measures |
|---|---|
Sales velocity per linear foot | How well shelf space turns into revenue |
Share of shelf | Brand presence compared with competitors, using linear footage, facings, and display area |
On-shelf availability | How often products stay buyable during store hours, with a goal of 95%+ at peak |
Category turn rates | Product turnover, with eye-level placement getting 15–25% higher turnover |
Planogram compliance | How closely shelves match the planned layout, adjacencies, and spacing |
Facings per SKU | Face-forward units per SKU, which affect visibility and purchase likelihood |
The percentage of time the shelf is effectively in stock follows a simple rule: available expected SKUs divided by total expected SKUs, times 100. A store with 92 of 100 expected SKUs on the shelf sits at 92% availability, and the out-of-stock rate is 8%. The denominator must be defined clearly for the number to mean anything.
Replenishment response time matters just as much. Research cited by ScienceDirect shows retailers with sub-2-hour response times achieve up to 2.5% higher on-shelf availability rates than category averages. Substitution rates expose retention risk: over 30% of shoppers who substitute during an out-of-stock event permanently adopt the replacement product.
Retailers who act on availability alerts within two hours recover significantly more revenue than those relying on end-of-day exception reports.
Availability as a Continuous Signal
Shelf conditions change by the hour. A single morning audit captures one moment and misses the rest of the day. Continuous monitoring keeps retail operational analytics current, so teams respond to what shoppers face now rather than what an auditor saw at opening.
The platform keeps a live view of shelf state and feeds it into inventory and replenishment workflows. Automated low-stock alerts support stock replenishment and shelf replenishment before a gap opens. Faster detection of misplaced items and tighter floor-to-backroom coordination reduce manual inventory walks. Continuous tracking also cuts losses from expiry and shrinkage, with reported reductions near 60% in some deployments.
This shift moves retail operations from periodic checks to continuous reality. Teams gain real-time floor visibility, fewer phantom-inventory errors, and store data aligned with warehouse systems. Demand forecasting improves, and inventory optimization follows from cleaner signals. The result is a measurable change in retail performance, not another report.
Shoppers don't grade availability on a curve. To them, a product is either there or gone, and that answer changes hour by hour. Inventory records show what should be there; the shelf shows what really is. Spatial intelligence on cameras already in place closes that gap. Prioritized action, paired with shopper-behavior linkage, turns leakage into a number teams can chase. Retail operational analytics then prove the recovery.
Retailers should drop the periodic audit mindset. Treat on-shelf availability as a live revenue signal, and respond to it every hour. Scaling follows the same logic: continuous monitoring, shared dashboards across retail operations, and training that builds capability. No new hardware required.
FAQ
How does spatial intelligence differ from a manual shelf audit?
A manual retail audit only captures one moment in time. Spatial intelligence on existing cameras watches the retail shelf all day long. It flags empty facings and misplaced products as they happen. Retail operations teams see the shelf from the shopper's view, and retail operations act without new hardware.
Which metrics prove that availability work pays off?
Retail teams track the share of time the shelf is in stock, estimated revenue leakage, substitution rates, and replenishment time. Retail operational analytics also show promotional performance and store response speed. These retail operations measures tie shelf state to money, not compliance.
Can this run on cameras a store already owns?
Yes. The platform applies computer vision to existing retail camera systems. Modern units deliver footage up to 20MP, and on-device processing cuts WiFi data transfer by up to 60%. Retail operations gain continuous shelf visibility, so retail operations scale without dedicated sensors.
How fast should a team act on an availability alert?
Research cited by ScienceDirect shows retail teams with sub-2-hour response times reach up to 2.5% higher on-shelf availability than category averages. Retail operations should treat alerts as live signals, not end-of-day reports. Retail leaders act within the hour.
Where does ai in retail operations fit alongside inventory systems?
Inventory records track deliveries and sales, but they never check the shelf. Up to 70% of undetected out-of-stock events come from phantom inventory. AI in retail operations closes that gap, and retail operational analytics prove the recovery across retail stores.
See Also
Why Stores Powered by AI Represent the Future of Retail
AI-Powered Combo Vending Machines: Key Features and Benefits for Modern Retail
How AI-Powered E-Commerce Tools Revolutionize Online Store Management
The Rise of AI-Powered Corner Stores: Essential Insights for Retailers
How to Launch an AI-Powered Corner Store with Minimal Investment
