How to evaluate ROI for autonomous retail in Hospitals & healthcare facilities.

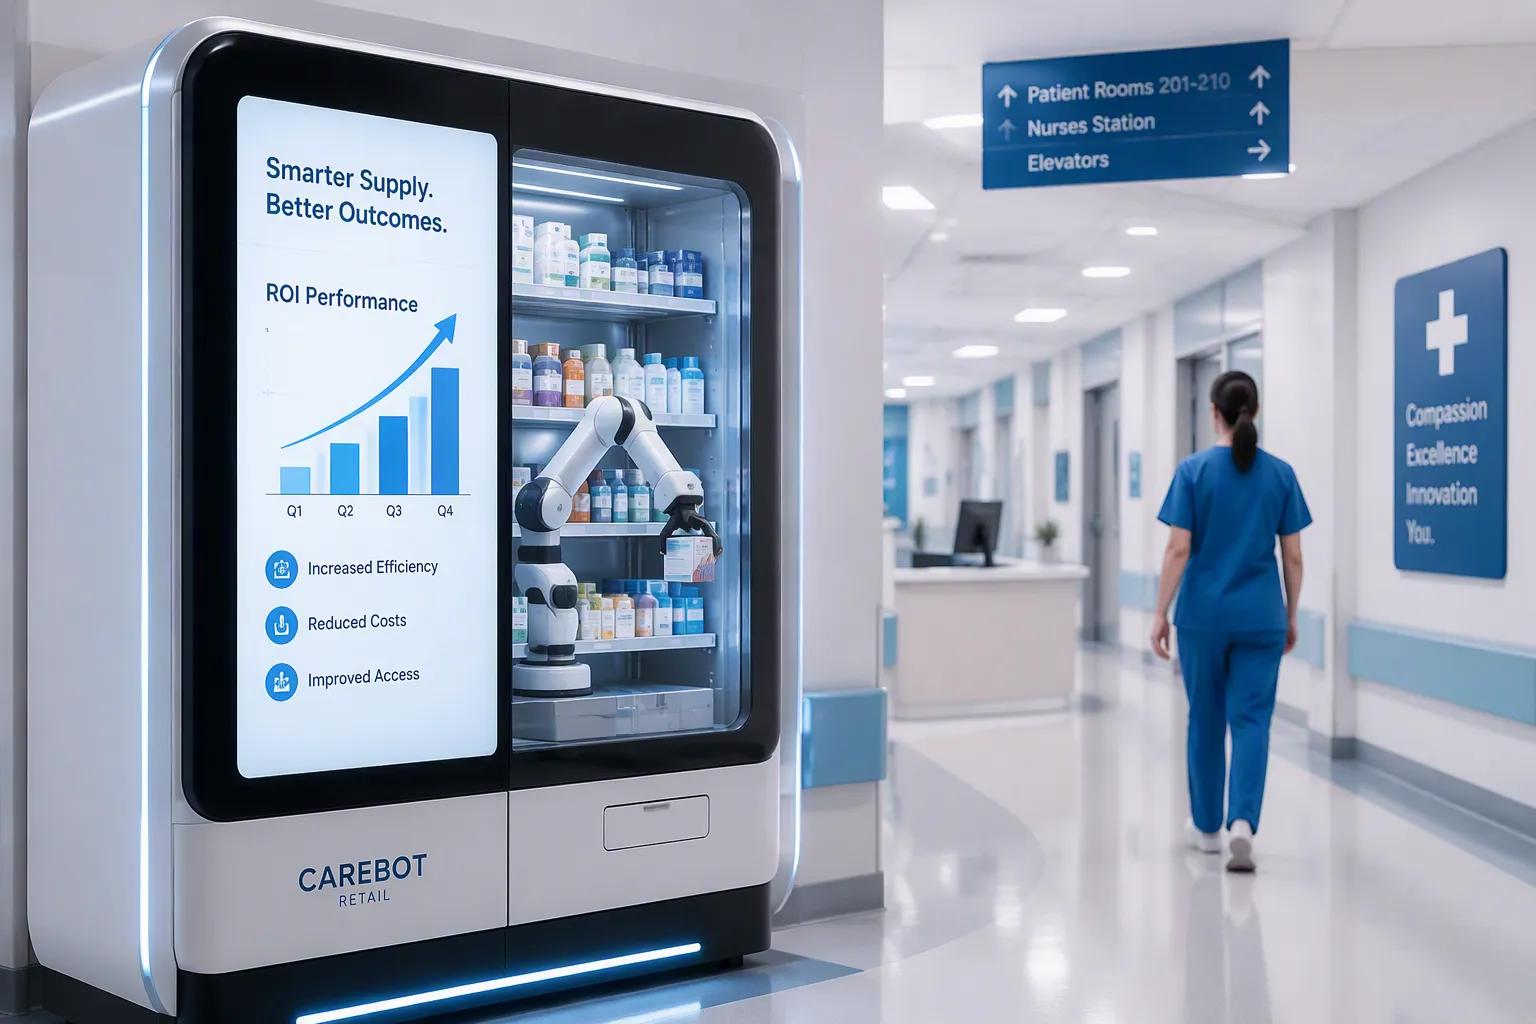
How do you justify the capital expenditure for a cashierless retail solution in a hospital setting? You face dual pressure: improving patient and staff experience while managing tight budgets. This post provides a practical framework to evaluate ROI. It goes beyond simple cost savings. The approach includes operational efficiency and strategic value. You will use baseline data, balanced scorecards, and board-level governance. Consider the average annual retail spending per patient in hospital settings is $734 (median $24). This figure shows the revenue opportunity. The framework helps you assess both financial and intangible benefits.
Key Takeaways
Use a balanced scorecard to measure financial, operational, and patient experience benefits.
Calculate ROI with the formula: (Net Benefit - Investment Cost) / Investment Cost * 100.
Aim for a payback period under three years to minimize risk.
Start with a pilot in a high-traffic area to validate assumptions.
Include hidden costs like IT integration and compliance in your analysis.
Key ROI Metrics for Healthcare Retail
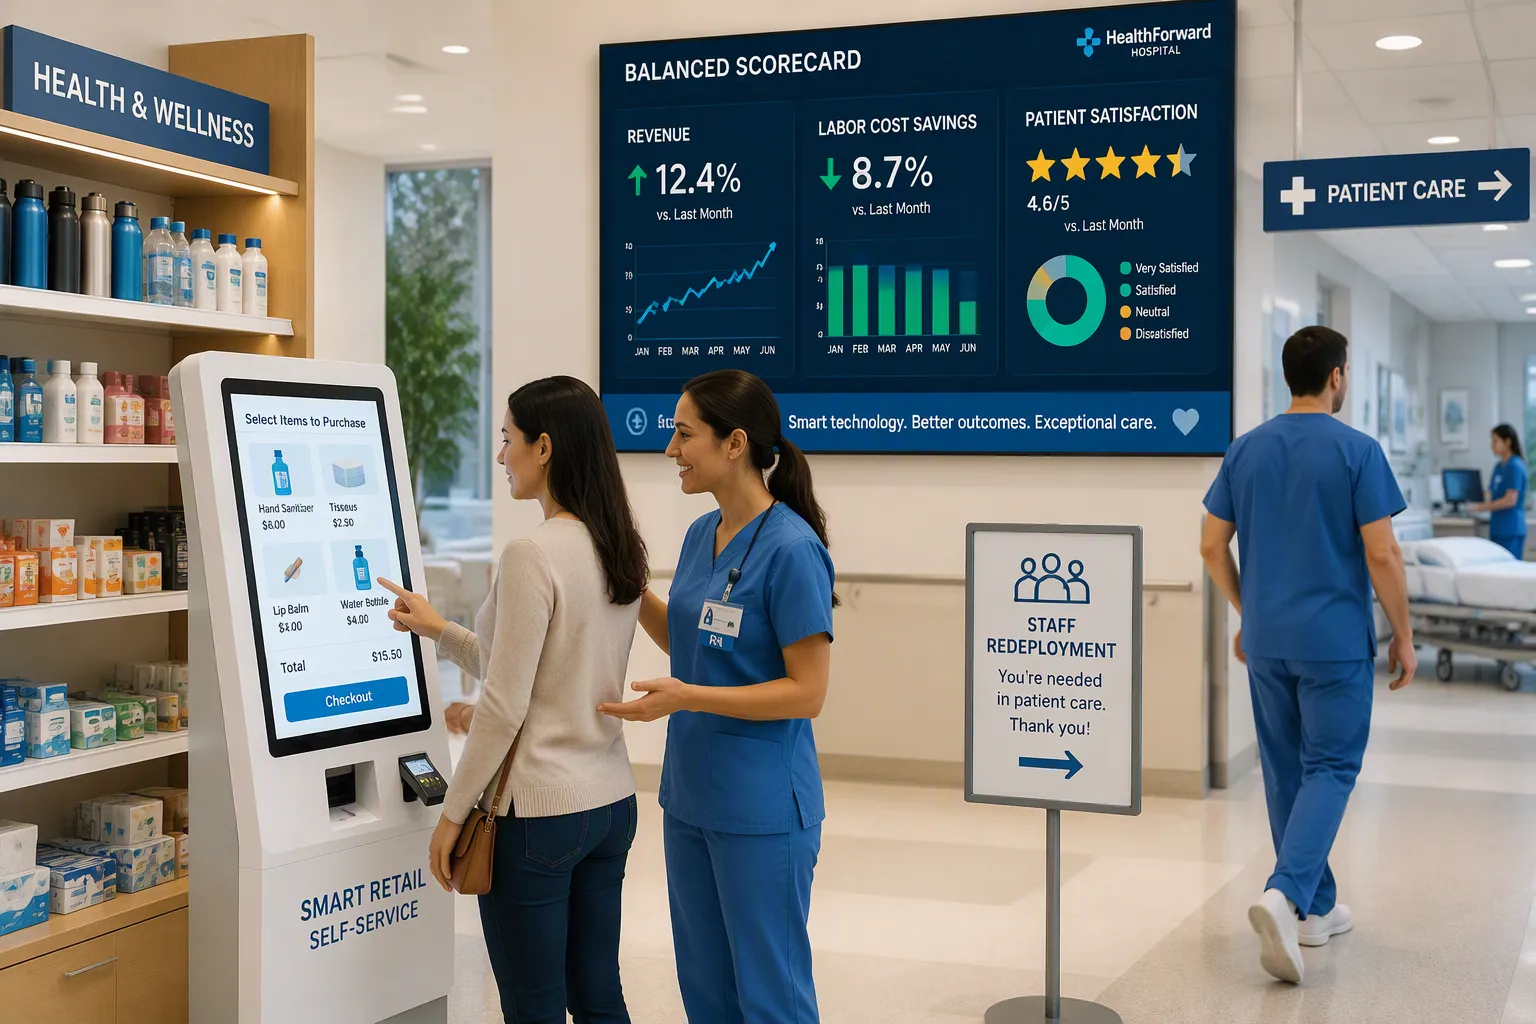
ROI evaluation starts with defining clear outcomes. You must tie these outcomes to your institutional goals. A balanced scorecard approach works best. This method includes financial, operational, and patient experience metrics. It prevents you from focusing only on cost savings. You need to measure what matters most to your hospital. The scorecard gives you a complete view of value. You can then make a stronger case for investment.
Direct Financial Gains
Start with incremental revenue per square foot. Autonomous retail operates 24 hours a day, seven days a week. It removes friction from the purchase process. You can capture more sales from visitors, staff, and patients. A traditional hospital gift shop closes at night. An autonomous market in the same space can generate substantially higher revenue because it never closes. Extended hours and reduced wait times drive this increase. You can also place these units in multiple locations across your facility. Each location adds revenue without requiring additional staff.
Next, consider labor cost avoidance. A traditional hospital retail location needs one or two cashiers per shift. For a 24-hour operation, you need coverage for three shifts. Costs include hourly wages, payroll taxes, and benefits. You can eliminate or reduce this staffing need with an autonomous solution. You can then reassign those employees to patient-facing roles. This move improves your budget and your patient experience at the same time.
Finally, look at shrinkage reduction. Automated inventory tracking reduces theft and waste. The system tracks every item from shelf to purchase. This accuracy lowers losses. It also improves inventory management. You spend less on replacing lost or expired goods. The savings add up over time.
Indirect Operational and Satisfaction Benefits
Patient satisfaction scores matter for hospital reputation and reimbursement. HCAHPS scores include environment and responsiveness domains. Access to food and retail items around the clock improves the patient experience. Family members and visitors appreciate the convenience. This access can boost your overall satisfaction scores. Higher scores can lead to better reimbursement rates from payers. The link between patient experience and revenue is direct.
Staff time saved is another benefit. Nurses and clinical staff spend time hunting for snacks or basic supplies. A nurse might walk to a distant cafeteria or vending machine several times per shift. An autonomous retail solution located near the unit saves that time. They can get what they need and return to patient care faster. This time savings adds up across every shift. Even a few minutes saved per shift per nurse translates to significant hours over a month. Those hours redirect to patient care.
Inventory waste reduction also helps your bottom line. Real-time data shows what sells and what does not. You can adjust ordering to match actual demand. This practice reduces expired or unsold inventory. It also frees up storage space for other uses. Better inventory management means less financial waste.
To fully evaluate ROI, you must include both direct and indirect metrics. The balanced scorecard approach gives you a complete picture. When you evaluate ROI, remember to include patient satisfaction data alongside financial figures. Without this balance, you risk underestimating the value of autonomous retail in your healthcare facility. Each metric tells part of the story. Together, they build a strong case for investment.
How to Evaluate ROI: A Step-by-Step Calculation Framework

You need a structured method to evaluate ROI for autonomous retail. Start with the core formula. ROI equals (Net Benefit minus Investment Cost) divided by Investment Cost, then multiplied by 100. Net Benefit breaks down further. It equals (Annual Revenue Increase plus Annual Cost Savings) minus Annual Operating Costs. This formula gives you a percentage. A positive percentage means your investment generates value. A negative percentage signals trouble.
The Payback Period matters just as much. Calculate it by dividing Total Investment by Net Annual Benefit. This figure tells you how many years you need to recover your initial spending. Most healthcare administrators prefer payback periods under three years. Longer timelines create risk. Technology changes, patient demographics shift, and leadership priorities evolve. A shorter payback period protects your capital.
The Core ROI Formula and Payback Period
You must gather solid baseline data before you calculate anything. Track your current retail sales per month. Document every labor hour spent on retail operations. Measure patient flow through gift shops and cafeterias. Record inventory shrinkage rates. Without this baseline, your ROI calculation rests on guesswork. Board members will challenge numbers you cannot support with evidence.
Your baseline data also helps you set realistic projections. Look at your current sales per square foot. Compare that figure to industry benchmarks for healthcare retail. The gap between your performance and the benchmark shows your growth potential. Autonomous retail typically narrows that gap through extended hours and reduced friction.
A Practical Example for a Mid-Sized Hospital
Consider a 200-bed hospital evaluating a single autonomous retail unit. This example walks through the calculation step by step.
First, estimate the investment cost. The unit itself costs $85,000. Installation and Wi-Fi infrastructure upgrades add $15,000. IT integration with your existing systems costs $10,000. Your total investment equals $110,000.
Second, project annual revenue increase. Your current gift shop generates $120,000 per year. The autonomous unit operates 24 hours daily. Industry data suggests extended hours can boost revenue by 30 percent. That increase equals $36,000 annually.
Third, calculate labor cost savings. Your gift shop currently employs two cashiers across two shifts. Wages, taxes, and benefits total $48,000 per year. The autonomous unit eliminates one full-time equivalent position. You save $24,000 annually. You reassign the other cashier to patient-facing work.
Fourth, estimate shrinkage reduction. Your current shrinkage rate runs about 3 percent of sales. Automated tracking cuts that rate in half. You save approximately $1,800 per year on reduced theft and waste.
Fifth, account for annual operating costs. The autonomous unit requires restocking labor, software licensing, and maintenance. These costs total $12,000 per year.
Now apply the formula. Annual Revenue Increase equals $36,000. Annual Cost Savings equals $25,800 ($24,000 labor plus $1,800 shrinkage). Total annual benefit equals $61,800. Subtract Annual Operating Costs of $12,000. Your Net Annual Benefit equals $49,800.
Calculate ROI using the core formula. Net Benefit of $49,800 minus Investment Cost of $110,000 gives you negative $60,200. Divide that by $110,000. Multiply by 100. Your first-year ROI equals negative 54.7 percent. This negative figure looks alarming, but it reflects the upfront nature of capital investments.
The Payback Period tells a clearer story. Divide Total Investment of $110,000 by Net Annual Benefit of $49,800. Your payback period equals 2.2 years. After that point, the unit generates pure positive returns. Most hospitals accept payback periods under three years. This project meets that threshold.
Remember that this example uses conservative estimates. Your actual results depend on location, traffic patterns, and product mix. A unit placed near the emergency department waiting room will outperform one tucked in a quiet corridor. Run this calculation for each potential location. Compare the results before you commit capital.
Critical Factors and Strategic Pitfalls in ROI Analysis
The example in the previous section assumes a smooth implementation. That assumption rarely holds true. Several hidden costs and strategic considerations can alter your ROI significantly. You must account for these factors to make a sound investment decision.
Hidden Costs and Implementation Challenges
Upfront investment in kiosk technology, along with ongoing maintenance and compliance costs for prescription-handling rules, can offset near-term labor savings. This is one of the most common hidden costs. You face several other challenges:
Varying patient safety and privacy regulations by state or country create hidden compliance burdens. Any high-profile error could slow adoption and increase liability.
Traditional pharmacy chains may face hidden revenue loss if kiosks cannibalize existing prescription income without offsetting synergies.
You must also consider IT integration with existing hospital systems. Connecting the autonomous retail platform to your EHR and security systems requires time and money. Wi-Fi infrastructure upgrades may be necessary to support reliable connectivity. Ongoing inventory management labor adds to your operating costs. Regulatory compliance costs for food safety and ADA accessibility also factor into the total investment. These costs can extend your payback period by several months or even years. When you evaluate ROI for autonomous retail, include all these hidden costs in your projection. Otherwise, your financial model will overstate the returns.
Strategic Alignment and Pilot Testing
ROI for autonomous retail is highly context-dependent. A unit in a quiet corridor generates different returns than one in a high-traffic area. A pilot program helps you validate your assumptions before committing significant capital. Place the pilot in a location with proven demand, such as the emergency department waiting room. Measure actual sales, labor savings, and staff satisfaction. Use real data from the pilot to refine your projections.
For board approval, consider a three-gate framework. This approach evaluates the investment from multiple angles:
Strategic alignment: Does the solution support your hospital's goals for patient experience and operational efficiency?
Financial viability: Do the projected returns meet your organization's threshold for payback period and overall ROI?
Operational readiness: Does your facility have the infrastructure, staff, and processes to support the technology?
This framework gives your board confidence that you have considered both opportunities and risks. It also provides a structured way to evaluate ROI across different potential locations. Start with a small pilot. Gather data. Then use that data to build a stronger business case for a larger rollout.
You now have a complete framework for evaluating autonomous retail investments. Start by defining clear metrics tied to your hospital's goals. Use the balanced scorecard approach to capture financial, operational, and satisfaction benefits. Apply the structured calculation formula with solid baseline data. Account for hidden costs like IT integration and compliance requirements.
ROI evaluation never ends. Track utilization trends monthly. Adjust projections as patient flow patterns shift. Review performance against your original assumptions.
Begin with a small pilot in a high-traffic area. Gather real-world data on sales and labor savings. Use those results to strengthen your business case for broader deployment.
Autonomous retail is becoming standard in modern healthcare. Early adopters who master ROI evaluation will lead in operational excellence and patient satisfaction.
FAQ
What baseline data should I collect before calculating ROI?
Track your current retail sales per month. Document every labor hour spent on retail operations. Measure patient flow through gift shops and cafeterias. Record inventory shrinkage rates. This baseline data grounds your projections in evidence. Board members will challenge numbers you cannot support with real figures.
How long should the payback period be for autonomous retail?
Most healthcare administrators prefer payback periods under three years. The example in this article shows a 2.2-year payback period for a 200-bed hospital. Longer timelines create risk. Technology changes, patient demographics shift, and leadership priorities evolve. A shorter payback period protects your capital investment.
Should I start with a pilot program before full deployment?
Yes. A pilot program validates your assumptions before you commit significant capital. Place the pilot in a high-traffic area like the emergency department waiting room. Measure actual sales, labor savings, and staff satisfaction. Use real data from the pilot to refine your projections for a larger rollout.
What hidden costs should I include in my ROI analysis?
Include IT integration with your existing hospital systems. Wi-Fi infrastructure upgrades may add to your investment. Ongoing inventory management labor increases operating costs. Regulatory compliance for food safety and ADA accessibility also factors into your total. These costs can extend your payback period by several months.
How do I present the business case to my board?
Use a three-gate framework. First, demonstrate strategic alignment with your hospital's patient experience goals. Second, show financial viability with your ROI calculations and payback period. Third, prove operational readiness with infrastructure and staffing plans. This structured approach gives your board confidence in your analysis.
See Also
Global Automated Retail: Micromarkets Versus Smart Stores Explained
Modern Retail Advantages: AI Combo Vending Machine Features
Retailers Guide: The Emergence Of AI Corner Stores
Walgreens Self-Checkout: Retail Convenience And Hurdles Examined