Key KPIs to track for autonomous store success in Airports & transportation hubs.

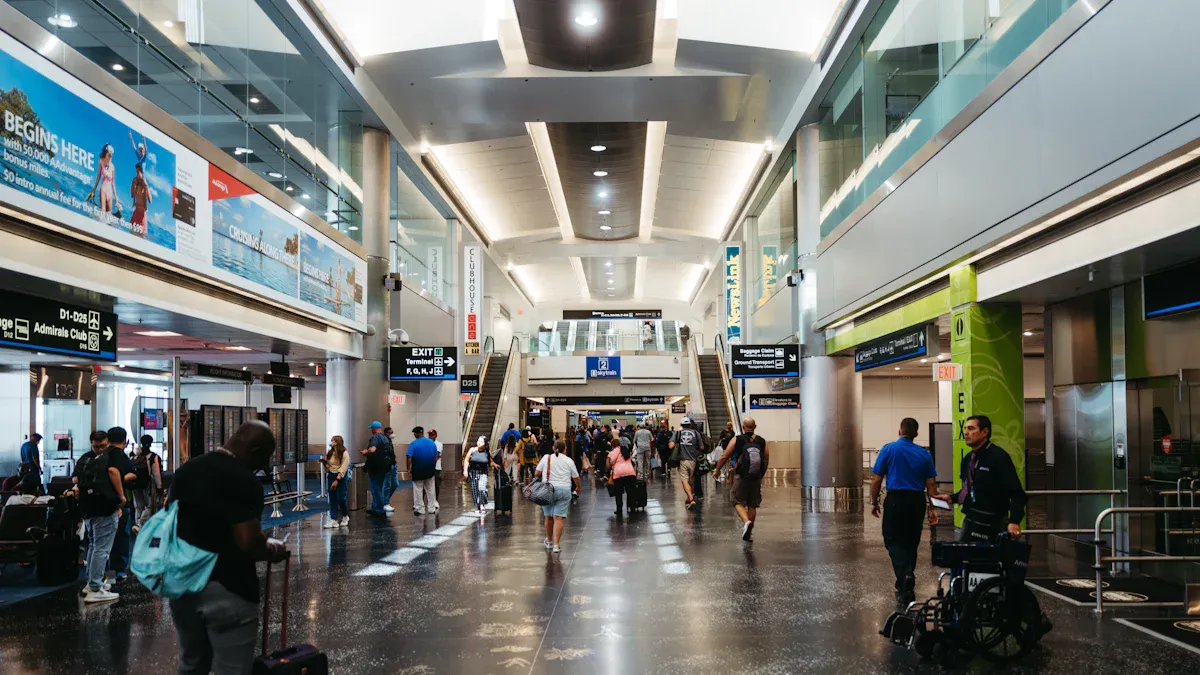
You drive autonomous store success by tracking measurable success metrics that shape your ecosystem. Focus on these KPIs: total revenue, passenger experience, conversion rate, inventory turnover, and digital analytics. Every KPI influences your store’s journey, from digital payment rates to passenger experience scores. Analytics help you understand digital trends, passenger experience, and ecosystem performance.
When you monitor KPIs, you create a digital journey for each passenger. Improve your ecosystem with analytics and digital tools that boost autonomous store success. Make every journey seamless and digital, so your ecosystem thrives.
Use digital analytics to measure passenger experience and maximize your ecosystem’s journey.
Prioritize KPIs that align with the digital journey and ecosystem needs.
Key Takeaways
Track total revenue to understand your store's financial health and make informed decisions.
Monitor customer satisfaction scores to improve the shopping experience and boost loyalty.
Use digital analytics to enhance passenger experience and optimize store operations.
Focus on inventory turnover to keep popular items in stock and reduce waste.
Regularly review KPIs to identify trends and make timely adjustments for better performance.
Sales KPIs
Total Revenue
You need to track total revenue to understand how much money your autonomous store brings in. This KPI shows the sum of all sales over a set period. In airports, total revenue helps you see if your store meets its financial goals. You can compare revenue across different days, weeks, or months. This comparison helps you spot trends and make better decisions. When you know your revenue, you can plan for busy travel seasons and adjust your inventory.
Average Transaction Value
Average transaction value tells you how much each customer spends on average. You calculate this by dividing total revenue by the number of transactions. In airports, this KPI helps you see if travelers buy more than one item or just grab a quick snack. If you want to increase this number, you can offer bundles or suggest related products. A higher average transaction value means your store uses its space and products well.
Sales per Square Foot
Sales per square foot measures how much revenue you make for every square foot of your store. In airports, space costs a lot and is often limited. You want to use every inch wisely. This KPI shows how well your store layout and product placement work. If you see low sales per square foot, you may need to change your displays or move popular items to better spots. In high pedestrian traffic areas, this metric becomes even more important. It tells you if your store can turn busy foot traffic into real sales. Sales per square foot is essential in airport retail because it indicates how well a store utilizes its limited and expensive space to drive revenue. This metric helps you assess various aspects of the store, such as layout and product placement, to enhance overall sales efficiency.
Tip: Review your sales per square foot every month. Small changes in layout can lead to big gains in revenue, especially in airports where every square foot counts.
Conversion Rate
Conversion rate shows the percentage of people who enter your store and make a purchase. You calculate it by dividing the number of sales by the number of visitors, then multiplying by 100. In airports, many people walk by or enter your store, but not all of them buy something. A high conversion rate means your store attracts the right customers and meets their needs. If your conversion rate drops, you may need to check your product mix or improve your signage. Tracking this KPI helps you turn more airport travelers into paying customers.
Remember: In airports, you face unique challenges. Travelers move quickly and have limited time. By focusing on these sales KPIs, you can make smart choices that boost your store’s performance and help you stand out in busy transportation hubs.
Customer Experience KPIs
Dwell Time
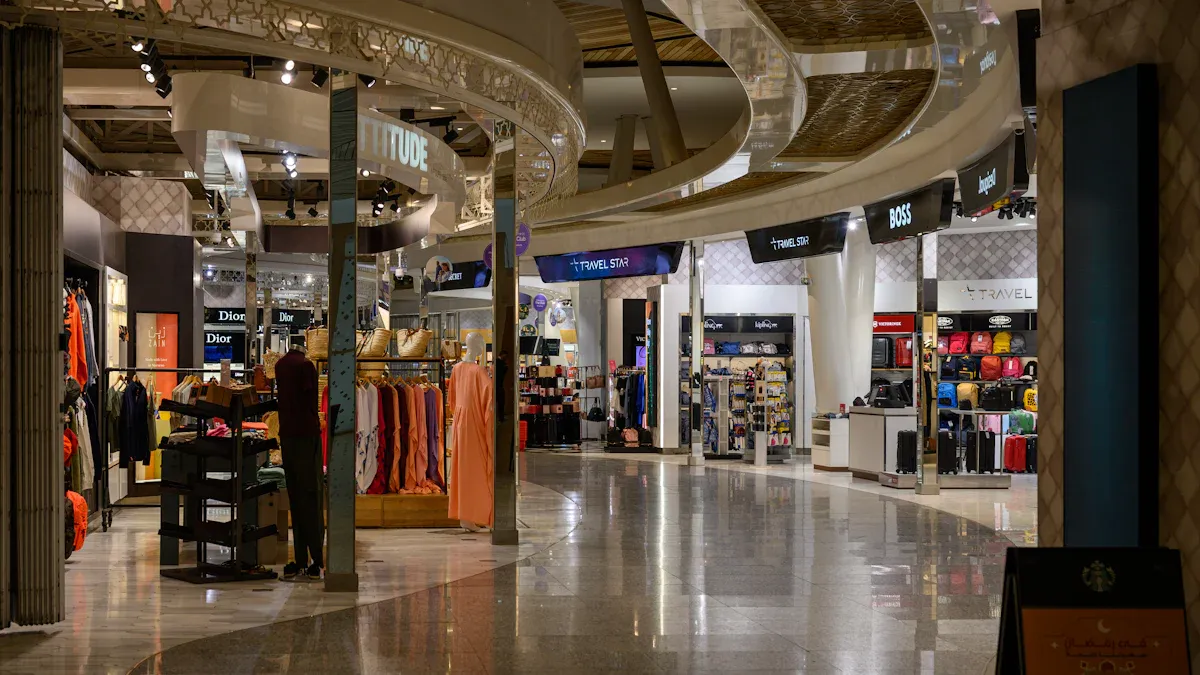
Dwell time measures how long customers stay in your store. In airports, you want to know if travelers spend enough time to explore your products. Longer dwell time often leads to higher sales. You can track this KPI with sensors or cameras that record how long each person stays. If you notice short dwell times, you can improve your store layout or add more personalization. For example, you can use data-driven personalization to suggest products based on what travelers like. This makes the shopping experience better and encourages customers to stay longer.
Tip: Adjust lighting and displays to create a welcoming atmosphere. This can increase dwell time and improve customer experience.
Customer Satisfaction Score
Customer satisfaction score shows how happy travelers feel after shopping in your store. In airports, you can collect feedback through surveys or digital kiosks. You can ask simple questions about their experience, product quality, and personalization. High scores mean your store meets customer needs. Low scores show you need to make changes. You can use Net Promoter Score (NPS) to measure if customers would recommend your store. Tracking this KPI helps you understand what works and what needs improvement. When you focus on customer experience, you boost store performance and attract more travelers.
Repeat Visit Rate
Repeat visit rate tells you how many customers return to your store. In airports, this KPI shows strong customer loyalty. You can track repeat visits with loyalty programs or digital receipts. High repeat visit rates mean travelers trust your store and enjoy the customer experience. Retaining customers costs less than finding new ones. Even a small increase in retention can raise profits by up to 95%. You can use personalization to reward loyal customers and encourage them to come back.
Repeat visit rate measures customer loyalty.
High rates show travelers return often.
Net Promoter Score reflects satisfaction and likelihood to recommend.
Retaining customers boosts profits.
Note: Start with a pilot to measure real performance. Track KPIs like sales, basket size, uptime, payment success, replenishment, customer acceptance, and ROI. Use this data to scale your operations in airports.
Operational KPIs
Inventory Turnover
Inventory turnover measures how quickly you sell and replace products in your store. In airports, you must keep shelves stocked with items travelers want. High inventory turnover means you move products fast and avoid waste. You can use real-time data to track which items sell best and adjust your orders. When you manage inventory well, you boost profits and keep your store efficient. Low turnover signals slow sales or poor product selection. You should review inventory turnover often to make sure your store stays competitive in airports.
Stockout Rate
Stockout rate shows how often your store runs out of products. In airports, stockouts can frustrate travelers and lead to lost sales. You can use real-time data to spot low stock levels and refill shelves quickly. Agentic AI systems help reduce stockout events by up to 40%. Amazon has cut stockouts by 32% with predictive inventory systems. Walmart has seen a 30% drop in out-of-stock events in pilot stores. Stockouts can cause customer defection rates of 15-25%. Preventing stockouts keeps travelers happy and encourages repeat visits.
Stockout events can lead to lost sales and unhappy customers.
Predictive inventory systems help you keep shelves full in airports.
Lower stockout rates improve customer satisfaction and store performance.
System Uptime
System uptime measures how often your store’s technology works without interruption. In airports, you need reliable systems to serve travelers quickly. Aim for near-perfect accuracy in product detection and billing, such as 99.9% or higher. You should add redundancy to sensors and AI models to keep operations running smoothly. Open standards and APIs help your systems work with third-party services, building trust with customers. High system uptime ensures seamless autonomous operations and keeps your store open during busy travel times.
Near-perfect accuracy improves reliability in airports.
Redundant systems minimize errors and downtime.
Interoperable technology builds customer trust.
Tip: Monitor system uptime daily. Quick action prevents disruptions and keeps your store running smoothly in airports.
Security & Loss Prevention KPIs
Shrinkage Rate
Shrinkage rate tells you how much inventory you lose because of theft, errors, or damage. You calculate shrinkage rate by dividing the value of lost goods by the total inventory value, then multiplying by 100. In autonomous stores, you must track this KPI to protect your profits. Airports and transportation hubs see high foot traffic, which increases the risk of loss. You can use cameras, sensors, and AI to monitor your store and reduce shrinkage.
Use real-time alerts to spot suspicious activity.
Review shrinkage data every week to find patterns.
Train staff to respond quickly to loss events.
Tip: Set a target shrinkage rate. If you keep shrinkage below 1%, you protect your bottom line and build trust with airport partners.
Incident Response Time
Incident response time measures how fast you react to security issues or system failures. You track this KPI by recording the time between an alert and your response. Quick response keeps your store safe and prevents bigger problems. In airports, you must act fast because travelers move quickly and expect smooth service. You can use automated alerts and remote monitoring to speed up your response.
Set up instant notifications for security breaches.
Assign clear roles for handling incidents.
Review response times after each event.
Note: Faster response times mean fewer losses and happier customers. Aim for response times under five minutes during peak hours.
KPI | What It Measures | Why It Matters |
|---|---|---|
Shrinkage Rate | Inventory loss percentage | Protects profits |
Incident Response Time | Speed of reaction | Prevents bigger problems |
🛡️ Security KPIs help you keep your autonomous store safe and efficient. Track these metrics to reduce losses and improve your store’s reputation in busy airports.
Technology Adoption KPIs
User Adoption Rate
User adoption rate shows how many travelers use your autonomous store’s technology. You measure this by dividing the number of unique users by the total number of potential users, then multiplying by 100. For example, if 500 out of 1,000 travelers use your store’s app or self-checkout, your adoption rate is 50%. This KPI helps you see if travelers accept and trust your technology.
A high user adoption rate means your store’s digital tools are easy to use. It also shows that travelers feel comfortable with the autonomous experience. If your adoption rate is low, you may need to improve your onboarding process or add clear instructions. You can use digital signage, staff ambassadors, or short video guides to help travelers understand how to shop.
Tip: Place simple step-by-step guides at the entrance. This helps new users feel confident and increases adoption.
Why User Adoption Rate Matters:
Shows if travelers accept your technology.
Helps you spot barriers to use.
Drives higher sales and better customer experience.
Payment Success Rate
Payment success rate measures how often transactions complete without errors. You calculate this by dividing the number of successful payments by the total number of payment attempts, then multiplying by 100. For example, if 980 out of 1,000 payments go through, your success rate is 98%.
A high payment success rate means your payment systems work well. Travelers expect fast and easy payments, especially in airports. Failed payments can frustrate customers and lead to lost sales. You should monitor this KPI daily. If you see a drop, check for technical issues or payment method problems.
KPI | What It Measures | Why It Matters |
|---|---|---|
User Adoption Rate | % of travelers using technology | Shows acceptance and ease of use |
Payment Success Rate | % of successful payments | Ensures smooth transactions |
Note: Keep your payment systems updated. Test all payment methods regularly to avoid errors and keep travelers happy.
Airport-Specific KPIs
Passenger Throughput
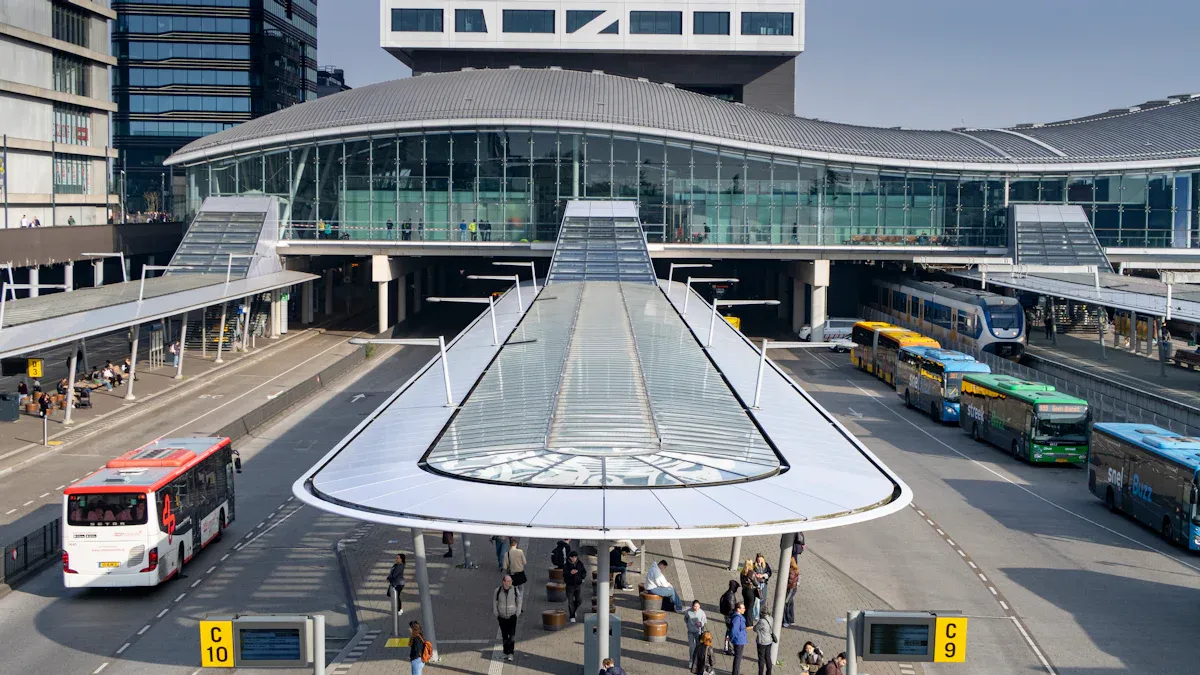
Passenger throughput measures how many travelers move through airports during a set time. You track this KPI to see the flow of people in terminals. High passenger throughput means more potential customers for your autonomous store. You can use sensors and digital counters to monitor this number. Smart airports use real-time data to predict busy periods and adjust store operations. When you understand passenger throughput, you can plan inventory and staffing to match demand. This KPI helps you avoid empty shelves and long lines.
Tip: Monitor passenger throughput every hour. Adjust your store’s layout and product displays to attract more travelers during peak times.
Lane/Desk Productivity
Lane or desk productivity shows how efficiently each checkout lane or service desk operates. You measure this KPI by counting transactions per lane or desk in a set period. In airports, you want every lane to serve travelers quickly. High productivity means your store uses its resources well. Smart airports use AI to manage lanes and desks, predicting peak times and allocating staff or equipment. You can improve productivity by adding self-checkout kiosks or digital payment options. When you track lane/desk productivity, you spot bottlenecks and make changes to speed up service.
Lane productivity helps you reduce wait times.
Desk productivity ensures smooth operations.
Digital tools boost efficiency in busy airports.
Peak Hour Performance
Peak hour performance measures how well your store operates during the busiest times. You track sales, transactions, and customer flow during these hours. Airports see spikes in passenger numbers at certain times, such as early mornings or late evenings. Smart airports use predictive maintenance to keep equipment running and minimize downtime. You can use AI to forecast peak hours and prepare your store. When you optimize for peak hour performance, you serve more travelers and increase sales.
Note: Prepare for peak hours by stocking popular items and adding extra staff or digital support. This keeps your store running smoothly when airports are busiest.
Passenger Flow Alignment
Passenger flow alignment means your store matches its operations to the movement of travelers in airports. You analyze traffic patterns to place products and services where travelers pass by most. Smart airports use passenger flow optimization to reduce congestion and improve experiences. You can use digital signage, app-based ordering, and immersive experiences to guide travelers to your store. At Kansas City International Airport and Chicago Midway International Airport, autonomous stores with Just Walk Out technology make shopping faster and easier. When you align with passenger flow, you attract more customers and boost sales.
Strategy | Effectiveness |
|---|---|
AI for resource management | Predicts peak times, improves efficiency |
Predictive maintenance | Reduces downtime, enhances operations |
Passenger flow optimization | Minimizes congestion, improves experience |
Integration of automation | Streamlines processes, reduces congestion |
Smart retail and F&B services | Eliminates long waits, enhances convenience |
Immersive digital experiences | Improves engagement and satisfaction |
Stakeholder collaboration | Promotes transparency, aligns goals |
AI-powered tools help you predict busy times and allocate resources.
App-based ordering and self-checkout kiosks reduce wait times.
AR wayfinding apps and VR entertainment zones increase passenger engagement.
Callout: At LaGuardia Airport, AI-powered waste bins doubled diversion rates in three months. This shows how smart airports use technology to improve efficiency.
You maximize store performance by aligning with passenger flow and peak hours. You serve more travelers, reduce congestion, and create a better shopping experience. Smart airports lead the way by using digital tools and automation to optimize every step.
Best Practices for Launching Autonomous Store Success
KPI Tracking Strategies
You need clear strategies to track KPIs in autonomous stores. Start by setting specific goals for each KPI. Use digital dashboards to monitor real-time data. In airports, you should review sales, customer experience, and operational KPIs every day. Create a routine for checking these metrics. Share results with your team so everyone understands store performance. Use alerts to spot sudden changes in sales or system uptime. You can adjust inventory or staffing quickly when you see trends. Make sure you track passenger flow and peak hour performance in airports. This helps you match store operations to busy times.
Tip: Set up automated reports. These reports save time and help you focus on important numbers.
Continuous Improvement
Continuous improvement keeps your store competitive in airports. You should use KPI analysis to find areas that need change. Try different tactics to improve your store. Root cause analysis helps you solve problems by finding what causes them. Kanban boards let you see tasks and manage workflows. Digital feedback management collects ideas from customers and staff. These tools make improvement easier.
Here is a table showing effective tactics for continuous improvement:
Tactic | Description |
|---|---|
Root Cause Analysis (RCA) | Identifies the root cause of problems to avoid treating symptoms, using methods like the 5 WHY technique and fishbone diagrams. |
Kanban | Visualizes work in progress to manage workflows, improve collaboration, and enhance task visibility. |
Digital Feedback Management | Utilizes digital tools for collecting feedback and new ideas, streamlining the continuous improvement process. |
You should review KPIs often and test new ideas. In airports, you can use feedback from travelers to improve product selection and store layout. Make small changes and measure their impact. Share success stories with your team. This builds a culture of improvement.
Callout: Use the best practices for launching autonomous stores to drive success in airports. Regular KPI tracking and continuous improvement help you stay ahead.
You drive store success by tracking KPIs in airports. Sales, customer experience, and operational metrics help you understand what works. Regular KPI analysis lets you spot trends and make smart changes. Use these insights to improve your store in airports. Focus on continuous improvement to stay ahead in airports. Start by setting clear goals for your store in airports. Take action and optimize your performance in airports.
Remember: KPI-driven strategies help you build a strong store in airports.
FAQ
What makes autonomous stores successful in airports?
You achieve success by tracking key metrics. Focus on sales, customer experience, and operational performance. Airports require efficient stores that handle high traffic and deliver fast service. Use real-time data to adjust inventory and improve customer satisfaction.
How do you measure customer satisfaction in airports?
You collect feedback through surveys, digital kiosks, or mobile apps. Airports often use Net Promoter Score to gauge satisfaction. Ask travelers about their shopping experience. Use this data to make improvements and boost loyalty.
Why is system uptime important for stores in airports?
You need reliable technology to serve travelers quickly. Airports operate around the clock. High system uptime ensures your store stays open and avoids disruptions. Monitor uptime daily to prevent errors and keep operations smooth.
How can you reduce shrinkage in airports?
You use cameras, sensors, and AI to monitor inventory. Airports see high foot traffic, so loss prevention matters. Set alerts for suspicious activity. Review shrinkage data weekly. Train staff to respond fast and protect your store.
What is passenger throughput and why does it matter?
Passenger throughput measures how many travelers move through airports in a set time. You track this to predict busy periods. Adjust store operations based on throughput. This helps you meet demand and maximize sales.
See Also
Comparing Micromarkets And Smart Stores In Global Retail
The Future Of Retail Lies In AI-Driven Stores
Understanding Walgreens Self-Checkout: Benefits And Hurdles Faced
AI-Enhanced Corner Stores: Essential Insights For Retailers
Transforming Online Retail Management With AI E-Commerce Tools