How to run A/B tests on assortment and layout in Airports & transportation hubs autonomous stores

A/B testing store layouts and assortments in high-velocity transit hubs requires sensor fusion, computer vision, and real-time spatial analytics. You can run controlled, single-variable micro-experiments without interrupting traveler flow or closing doors. Physical store downtime in busy airports costs significant revenue. You must test store changes dynamically while passengers rush to their gates.
Computer vision paired with shelf weight sensors tracks every shopper movement and product interaction continuously. You gain actionable spatial data without introducing friction to the customer journey. These advanced tools help you optimize inventory placement, increase conversion rates, and maximize revenue per square foot in your high-traffic autonomous stores.
Key Takeaways
Smart sensors and cameras track shopper movements without closing store doors.
Testing one change at a time helps you find winning store designs.
Flight schedule data helps balance traffic spikes for accurate test results.
Airport testing labs allow you to test store layouts safely first.
Measuring Baseline KPIs in Autonomous Stores
Defining Transit-Specific Conversion Metrics
You must track specialized key performance indicators to understand shopper behavior in high-traffic hubs. Standard retail metrics often miss the speed of transit environments. You need precise data points like dwell-time yield, item pick-up rates, and friction-free checkout conversions to measure true store performance.
Location | Daily footfall | Weekly footfall | Notes |
|---|---|---|---|
Airport/Station retail | 10,000–50,000 visitors | 70,000–350,000 visitors | Classified as a high-volume transit hub |
You calculate your store conversion using a simple formula: conversion rate percentage = total transactions divided by total visitors multiplied by 100. For example, if your store receives 4,200 visitors and generates 630 transactions, you divide 630 by 4,200 and multiply by 100 to reach a 15% conversion per footfall. You can evaluate layout changes accurately when you track these numbers continuously.
Capturing Real-Time Sensor Baselines
You must establish reliable pre-test baselines before changing any store layout. Integrated overhead cameras track natural foot traffic patterns without slowing down busy travelers. You capture organic movement across every aisle through continuous visual monitoring.
Weight sensors embedded in shelf units work alongside these cameras to detect product interactions instantly. The weight changes signal exact pick-up and drop-off events when a customer touches an item. Sensor fusion combines these data streams to build your baseline metrics in autonomous stores.
You analyze these combined signals to pinpoint traffic bottlenecks and cold zones. The spatial analytics system logs every interaction automatically while shoppers move toward their gates. You gain a clean baseline to measure future store tests through this continuous data capture.
Designing Single-Variable Layout and Assortment Tests
Isolating Assortment vs. Spatial Layout Variables
To run successful A/B tests in autonomous transit stores, you must isolate a single variable at a time. Testing multiple changes simultaneously destroys data causality. You cannot determine whether revenue shifts come from product selection or item placement when you swap merchandise and move store shelves together.
You establish test hypotheses by separating product catalog adjustments from physical layout alterations. For example, you can test product assortment by replacing standard toiletries with premium organic alternatives on a specific fixture. You keep shelf height, locations, price tags, and lighting identical. Alternatively, you can test spatial layouts by moving grab-and-go snack displays from the rear wall directly adjacent to the entrance, while maintaining the item catalog.
Valid tests require testing one isolated variable per store zone to preserve exact spatial causality in your analytics engine.
By keeping spatial variables static during an assortment test, you measure customer product preferences with extreme accuracy. When you alter fixture positions during a layout experiment, you measure pure spatial accessibility. Testing one clear variable keeps your team focused on reliable outcomes. Your spatial analytics platform tracks the exact cause of shopper actions. You learn whether higher pick-up rates stem from product appeal or fixture visibility. You avoid misleading conclusions when evaluating product changes independently from layout changes. This clarity helps you optimize shelf space and maximize revenue per square foot.
Controlling for Flight Schedules and Passenger Spikes
Transit hubs experience volatile traffic swings based on external flight and train schedules. A delayed international flight can flood your autonomous store with hundreds of tired passengers within minutes. Conversely, gate reassignments can turn a primary store corridor into an empty space instantly. You must normalize your spatial analytics data against these external operational shocks to ensure valid test results.
To account for these traffic spikes, you integrate your computer vision backend directly with real-time flight information display systems (FIDS). You match store footfall data with flight departure times, arrival status, demographics, and gate proximity metrics. This integration allows you to segment conversion metrics by specific traveler profiles and flight windows.
You normalize your test data by comparing store performance across identical schedule conditions rather than raw time blocks.
Traffic Variable | External Impact | Data Normalization Method |
|---|---|---|
Flight Delays | Unplanned footfall spikes | Filter metrics by gate departure timestamps |
Gate Shifts | Instant drop in traffic | Segment baseline by active gate assignment |
Peak Commuter Hours | Rapid dwell time decreases | Group conversion data by travel volume density |
Your analytics platform weights shopper interactions against traffic density in real time. The software assigns equal statistical weight to store performance during quiet off-peak hours and boarding rushes. You gain consistent behavioral insights across all store operating hours. You evaluate variant performance during matching peak periods across different days. You compare Monday morning commuter surges against previous Monday morning commuter surges with identical passenger volumes. Furthermore, you eliminate external noise by filtering out operational disruptions like evacuations, weather delays, or gate changes.
This rigorous data normalization guarantees that observed conversion lift directly reflects your specific store changes. You eliminate guesswork and make confident deployment decisions across your entire airport network.
Executing A/B Tests in Autonomous Stores
Utilizing Airport Testing Labs for Initial Rollouts
You can validate store variations safely inside dedicated airport testing labs before launching full-scale deployments across your retail network. High-volume transit locations leave no room for operational trial and error. A failed layout change in a main concourse store risks immediate revenue loss and creates severe passenger bottlenecks. Testing labs replicate real airport environments without exposing live traveler traffic to unproven store concepts.
Dedicated testing labs let operators measure customer responses and camera tracking performance in controlled spaces before modifying primary retail locations.
You construct these innovation spaces in secondary airport zones or off-site facilities. You outfit the lab with identical overhead vision cameras, shelf sensors, and entry gates matching your active store fleet. You recruit test shoppers, airline employees, or off-duty crew members to walk through simulated purchasing scenarios. You observe how individuals navigate new aisle widths, interact with promotional endcaps, and select items under timed conditions.
These controlled rollouts highlight unexpected tracking blind spots and physical friction points early. You refine your floor plans based on raw sensor output rather than assumptions. You confirm that your spatial tracking system maintains complete accuracy during high-density footfall surges. Once a specific layout variant proves its value in the lab, you push the update to live concourse stores with complete confidence.
Dynamic Planogram Testing with Computer Vision
You can execute physical and visual planogram adjustments dynamically inside live autonomous stores while maintaining continuous system accuracy. Modern transit retail relies on flexible fixtures like digital shelf edge displays, dynamic LED tags, and modular smart racks. You update pricing, promotional messaging, and visual branding across specific shelves instantly through centralized inventory software.
You execute dynamic planogram changes using a structured, step-by-step physical and digital recalibration process:
You update product mapping coordinates within your central inventory platform.
You change the digital shelf edge displays to match the new item arrangement.
You physically restock the smart racks with the target test merchandise.
You run an automated system recalibration to verify weight sensor baselines and camera coverage.
This synchronized process prevents tracking discrepancies when you shift item locations. Weight sensors beneath each shelf instantly tare to the new baseline weight of the replacement inventory. Overhead computer vision algorithms update spatial bounding boxes around the newly positioned items. The multi-sensor platform links the physical shelf location to the correct product SKU immediately.
You maintain continuous tracking fidelity throughout the entire experiment. Shoppers pick up newly arranged items while computer vision cameras record exact item selections accurately. The system attribute every pick-up, put-back, and final purchase to the precise product coordinates without manual intervention. You gain clear performance data on your planogram variations while keeping the store open and operating at full speed.
Analyzing Spatial Data and Iterating Store Layouts
Evaluating Interaction Heatmaps and Pick-Up Rates
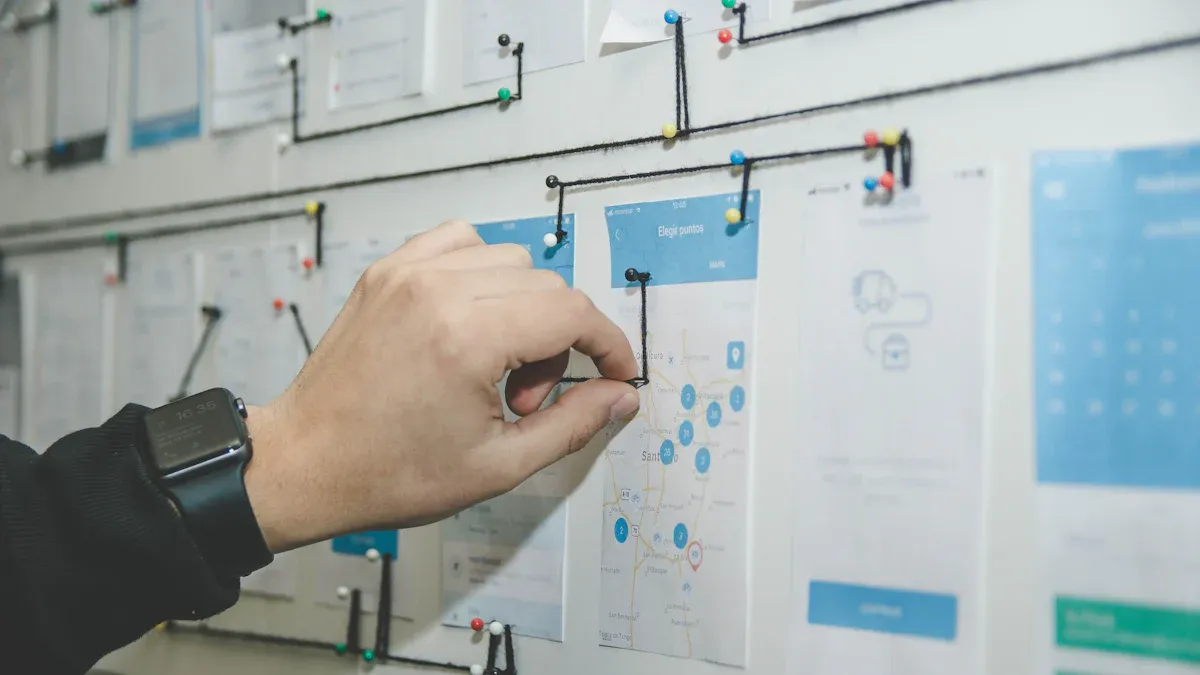
You evaluate real-time spatial data to understand how passengers navigate your store layout. Cloud-native vision AI tools like NVIDIA Metropolis Microservices generate detailed heatmaps and trajectory maps. These tools estimate store occupancy and track shopper flow across multiple camera angles. The system measures shopper dwell time and aisle traffic without gathering personally identifiable information.
You compare interaction heatmaps against actual item pick-up rates to measure fixture performance. A crowded aisle does not always yield high sales volume. You discover dead zones where travelers walk past items without stopping. When you identify cold spots, you adjust fixture placements or lighting to draw passenger attention. High pick-up rates on specific smart racks signal strong visual appeal. You leverage this spatial intelligence to place high-margin products directly along primary walking paths.
Establishing Continuous Optimization Protocols
You establish continuous testing loops to keep your store performance high. Customer flight schedules change constantly, so layout optimization requires ongoing physical and digital adjustments. You systematically convert spatial insights into immediate planogram iterations.
You execute structured optimization steps to refine your retail footprint:
You review shopper trajectory heatmaps weekly to spot changing foot traffic patterns.
You identify low-converting shelves with high dwell times but low pick-up rates.
You rearrange product placements to increase visibility for fast-moving travel items.
You monitor real-time conversion metrics to confirm revenue lift after layout edits.
Continuous spatial testing turns physical retail layout design into a repeatable, data-driven science.
You update your store configurations based on long-term data trends rather than quick assumptions. You deploy successful layout variations across your broader network of autonomous stores. Regular data analysis helps you eliminate bottlenecks near payment zones and high-traffic entrances. You maximize revenue per square foot continuously while preserving a fast, friction-free shopping experience for busy travelers.
Systematic A/B testing on store layouts and product assortments unlocks maximum revenue per square foot in high-rent transit hubs. You eliminate guesswork from physical store design using advanced technologies like computer vision and spatial AI. These smart vision tools track real shopper interactions accurately without disrupting busy travelers. You discover winning shelf configurations quickly while keeping your store doors open continuously. Now you must take immediate action to secure your competitive advantage. Implement a structured, continuous testing framework in your autonomous stores today. Partner with your retail teams to analyze spatial data and capture higher profit margins across your entire transportation network.
FAQ
What is the main benefit of A/B testing in autonomous transit stores?
You maximize revenue per square foot without closing your physical doors. Continuous testing reveals optimal product placement and aisle layouts. You optimize traveler flow and increase checkout conversion rates while keeping your store fully operational.
How do computer vision and shelf sensors track layout changes?
Computer vision cameras track visual movement across every aisle. Embedded weight sensors detect immediate item pick-ups on individual smart racks. Sensor fusion merges these data streams to record exact customer interactions without manual counting.
Why must you test only one variable at a time?
Isolating a single variable guarantees clear causality for your spatial analytics platform. You cannot determine whether revenue shifts come from new items or shelf positions when you change merchandise and layout together. Single-variable testing preserves exact data integrity.
How do you protect test data from sudden flight delays?
You connect your spatial analytics backend directly to real-time flight information display systems. The platform correlates footfall shifts with gate status, passenger volumes, and schedule changes. You normalize metrics by comparing store performance across matching traffic density periods.
See Also
Comparing Global Smart Stores And Micromarkets In Automated Retail
Launching An Affordable Artificial Intelligence Corner Shop On Budget
Understanding Why Smart Artificial Intelligence Retail Represents Tomorrow Future
Uncovering Creative Unconventional Placements For Modern Automated Vending Machines
Revolutionizing Internet Store Operations Through Advanced Smart Commercial Software