How Spatial Intelligence Turns Existing Cameras Into a Real-Time Operations Tool

Restaurant operators often steer by lagging indicators. Ticket times, refunds, and complaint rates all report what already went wrong. None of them show what is happening right now.
So here is the question worth asking: what if the cameras already on the ceiling could flag a bottleneck while it forms, before it costs a sale? Spatial intelligence makes that possible. It applies intelligence to existing camera feeds and turns passive footage into a live operations tool. No new hardware is required. Teams move from reacting to yesterday's numbers to acting on today's reality. That shift changes how spatial intelligence for restaurants works in practice.
Key Takeaways
Spatial intelligence uses the cameras already in your restaurant to show you what is happening right now.
You can find problems like long lines or slow handoffs before customers leave.
The system turns a manager's gut feeling into a dependable tool that works on every shift and at every location.
Instant alerts help you fix problems fast and win back lost money.
You can easily compare how well things work in different places and share the best ways of doing things.
The Restaurant Lagging Indicator Trap
Why Lagging Metrics Fail
Ticket times, refunds, complaint rates, and speed of service metrics all report results after something happens. They are lagging indicators. By the time a satisfaction score drops, the guest has already had a bad experience and may not come back. Star ratings work the same way. A location can keep a 4.1 rating while negative food and service mentions rise inside review text. The headline number hides the decline.
Ticket times are especially misleading. This compound metric mixes order complexity, station capacity, staff coordination, and customer behavior at pickup. A slow number hides which of those factors broke down. Surveys add another layer of delay. They arrive late and reflect subjective memory, so they cannot guide a decision made in the moment. Without breaking apart these metrics, operators treat symptoms instead of causes.
The Cost of Reactive Management
Lag measures such as monthly same-store sales reports and guest complaint summaries describe results after the fact. A regional director may see an 8% same-store sales drop, but six weeks pass before the team investigates, and another month of revenue is lost. Complaint summaries arrive only after a guest has already left a one-star review.
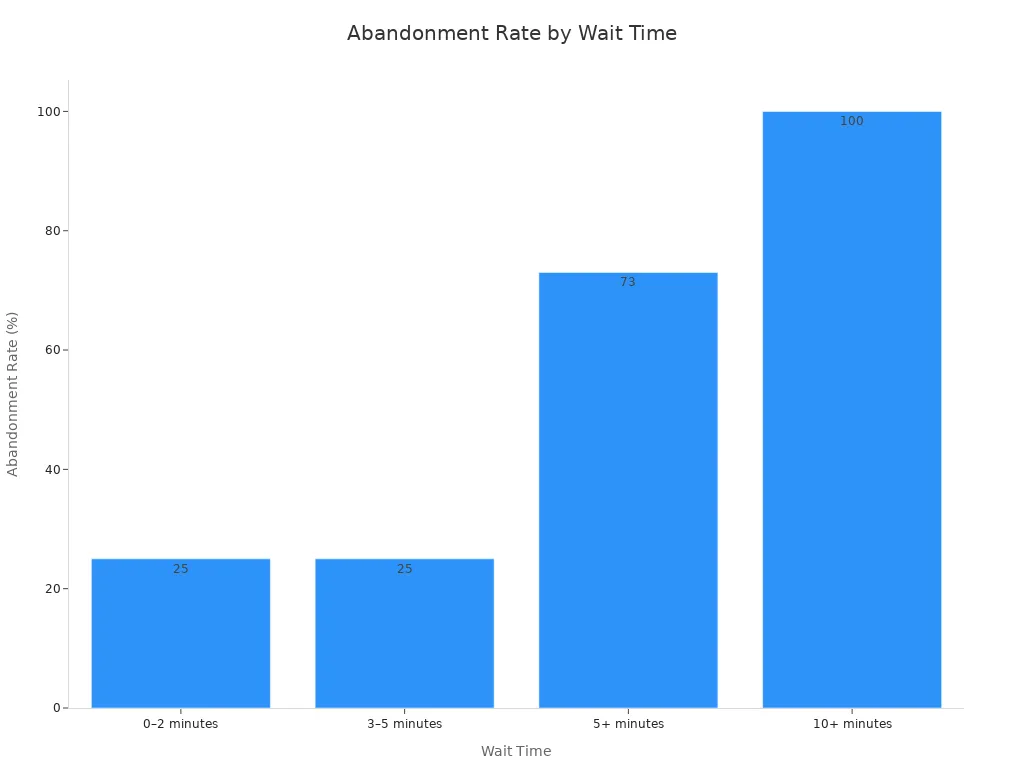
The revenue loss grows when a bottleneck goes undetected. Customers do not wait forever. In one survey, 61% of respondents said they had left a line before their turn, and 73% said they would give up a purchase after five minutes. For quick service restaurants, a queue build-up that triggers abandonment can form in under three minutes. That short window to step in leaves no room for a report that lands next month. Operators in the qsr space need a signal while the guest is still standing in line, not after the sale is gone.
Lag measures tell you what already happened. Lead measures show what is happening now.
What Existing Cameras Show You Right Now
Signals Already in View
The video already coming from the ceiling holds a lot of useful information about daily operations. Spatial intelligence brings these signals out as real, watchable events:
How many people are in line at drive-through, counter, and kiosk
Guests in the lobby who seem unsure where to go or stand around oddly
Gaps between when the kitchen finishes an order and when it gets handed off
Differences between how many delivery orders come in and how many dine-in guests arrive
Order mistakes caught before the food is handed over
Pickup delays and customers who get left waiting without anyone speaking to them
These are not vague numbers. They are visible actions that cameras already record. Today, no one watches them as they happen. A camera above the counter records every guest who steps back from the register, but that moment goes by without anyone noticing. Movement in the drive-through lane, where cars are, and how many staff are at each station all appear in the frame, but no one reads them.
The Three-Minute Window
This section is all about speed. A line can grow into people leaving in under three minutes. The time to step in is very short. Waiting five minutes is even worse: 73% of customers leave at that point, and those who wait past five minutes come back 34% less often within 30 days.
Compare this to slower tools. Ticket times and surveys show a problem long after the guest is gone. A survey cannot flag a crowded lobby while it is forming. A ticket time cannot show an order stalling at the pass. By the time either number changes, the sale is already lost.
Existing cameras are the only data source already in place that can catch these moments live. They need no new wiring, no extra sensors, and no rebuilding. The intelligence layer reads what the lens already sees and turns it into an alert a shift manager can act on. That is the difference between plain footage and a real tool.
How Spatial Intelligence for Restaurants Scales Instinct

From Intuition to System
Experienced managers get a feel for busy moments over time. They can tell when the line is about to break or when a handoff is stalling. Through repeated exposure, operators learn to expect when the dining room is about to turn. They also learn to spot when the kitchen is falling behind. They can sense whether labor is too heavy or too light. This instinct lets them sense problems before those problems show up in financial reports.
Intuition has its place, but running a restaurant on vibes and "feel" alone is risky; without examining what the data says, managers overlook inefficiencies or overestimate profitability, and closer inspection of reports often reveals hidden expenses eroding margins.
That instinct does not scale across shifts or locations. Relying on gut feeling for ordering leads to waste, overordering, missing product, and unnecessary spending. Building schedules on instinct instead of actual demand patterns causes slow days to be overstaffed and busy days to be understaffed. In multi-unit operations, the costs of guesswork add up quickly.
Spatial intelligence for restaurants solves this problem. It uses existing cameras to rebuild the physical space in 3D and adds behavioral context on top. No new hardware or sensor overlays are required. This turns managerial instinct into a system that gives real-time, actionable insights to every shift manager. The system acts as a second set of eyes and a co-pilot, not a replacement for judgment.
Prep vs. Handoff
A single ticket time hides the real cause of a slowdown. Spatial intelligence breaks that compound metric apart and separates a prep problem from a handoff problem. The table below shows how the system tells them apart.
Dimension | Prep Bottleneck Evidence | Handoff Delay Evidence |
|---|---|---|
What is compared | System intent vs. physical execution across workflows | What was prepared vs. what was handed off |
Example signal | One station limits throughput while others stay stable | Gaps between expected and actual handoff tied to refunds and remakes |
How the system distinguishes | Maps physical events to item, order, station, and shift | Compares expected vs. actual prepared-and-handed-off events |
This distinction matters in quick service restaurants. Handoff delays are a separate throughput constraint. Every handoff adds delay and error risk. Handoffs multiply when packaging is separate from assembly or when multiple channels share one pass. Prep bottlenecks form a separate constraint. Poor prep placement forces staff to leave stations to fetch components. To improve speed, teams reduce handoffs and steps rather than pushing staff to move faster.
The system also detects customer confusion at kiosks and flags a forming queue at the drive-through before it grows. It catches pickup delays with unacknowledged customers. Managers can shift staffing before a queue forms. That is how spatial intelligence for restaurants scales instinct. The intelligence layer reads what the lens already sees and gives every shift manager the same clear view.
The Business Impact of Real-Time Visibility
Recovered Revenue and Protected Capacity
Real-time detection connects straight to business results. Stopping abandonment brings back revenue that would otherwise walk out the door. Fixing bottlenecks protects capacity. Catching errors before handoff brings guests back. The main value is the move from reactive management to real-time control.
Under the Theory of Constraints' first focusing step (Identify the Constraint), a restaurant example is given: food preparation is limited by the size of the grill station. This shows how a physical capacity limit (the grill) caps restaurant throughput, and why spotting such a limit in real time is the first step to protecting capacity.
A queue zone system makes this practical. Workstations are digitally mapped with expected capacity limits based on cycle time, layout, and takt. Items entering and exiting each queue zone are detected and logged, capturing both count and time-in-queue. When queue length or wait time goes past set limits, the system alerts supervisors. All queue data is stored and shown to support planning and layout changes. These steps prevent downstream delays, improve takt time adherence, reduce work-in-progress and labor waste, and optimize resource allocation. For quick service restaurants, this matters most at pickup, where a stalled order turns into a lost sale.
Scaling Across Locations
Spatial intelligence for restaurants scales across locations. It gives a shared view of operations, surfaces patterns, and copies high-performing practices. A centralized dashboard lets teams monitor sales live, standardize menus and pricing, and track branch performance instantly. Automated reporting replaces slow manual exports with live dashboards. Standardized KPIs let performance be compared consistently across sites.
Benefit | Supporting detail |
|---|---|
Centralized management | All outlets managed from one dashboard; branch performance tracked instantly |
Faster decision-making | Automated reporting and live visibility let owners decide quicker |
Operational consistency | Standardized pricing and instant menu syncing across branches |
Scalable expansion | Standardized systems let chains open new outlets without rebuilding processes |
This raises standards through clarity. When everyone can see what is happening, best practices become visible and repeatable. That visibility turns spatial intelligence for restaurants into a shared standard. No new hardware is needed at any location. The intelligence is applied to existing cameras.
The operator's question has changed. Yesterday's numbers no longer lead the conversation. The question now is simple: can a manager see what is happening right now and act on it? Real-time control is becoming the new standard for restaurant operations. The cameras already in place make that standard reachable.
Teams that watch live signals will spot bottlenecks while guests still stand in line. They will fix handoffs before orders stall. This shift rewards speed of sight, not speed of report.
The tools are already on the ceiling. Spatial intelligence is what turns them on.
FAQ
Does spatial intelligence need new cameras or sensors?
No. The system uses the cameras already in the restaurant. It rebuilds the physical space in 3D from those feeds and adds behavioral context on top. Operators install no new hardware and no sensor overlays. The intelligence layer does the work.
How is this different from standard video analytics?
Standard analytics counts objects and stops there. Spatial intelligence separates causes. It tells a prep bottleneck apart from a handoff delay, tracks time in each queue zone, and flags customer confusion at kiosks. Managers get a diagnosis, not just a headcount.
What does a shift manager do with an alert?
The manager acts while the guest is still there. A forming drive-through queue triggers a staffing shift. A stalled handoff triggers a check at the pass. A confused kiosk customer triggers a greeting. Each alert points to a specific action inside the short window to step in.
Can a multi-location operator compare sites fairly?
Yes. Standardized KPIs let teams compare performance the same way across branches. A centralized dashboard shows live sales and branch performance instantly. Shared visibility surfaces patterns and makes high-performing practices repeatable, without rebuilding processes at each new site.
Why not just wait for ticket times and surveys?
Those metrics arrive after the guest has left. A queue can turn into abandonment in under three minutes. Surveys and ticket reports cannot flag a crowded lobby while it forms. Live camera signals catch the moment when a manager can still save the sale.
See Also
Why Stores Powered By Artificial Intelligence Will Dominate Tomorrow
How Artificial Intelligence E-Commerce Tools Revolutionize Online Store Management
The Emergence of AI-Powered Corner Stores: Essential Insights for Retailers
How to Launch an AI-Powered Corner Store with Low Investment
Transforming Spaces: The PARC at Tysons - From Container Store to Community Center
