Key KPIs to track for autonomous store success in Hospitals & healthcare facilities


Leaders in hospitals should track a short list of key KPIs to judge autonomous store success. The most important ones are stockout rate, inventory accuracy, system uptime, and shrinkage rate. Revenue per square foot, basket size, and gross margin complete the operational and financial picture. These metrics reveal whether the store runs reliably and pays for itself.
Customer experience KPIs, such as adoption rate and transaction time, show how well staff and patients use the store. Staff time reclaimed and after-hours utilization capture the human impact. Together, these key KPIs fall into four groups: operational efficiency, financial performance, customer experience, and staff and patient impact. Each group answers a distinct question about store health.
Key Takeaways
Track stockout rate and inventory accuracy to ensure supplies are always available for patient care.
Monitor system uptime and shrinkage rate to keep the store running reliably and reduce losses.
Measure revenue per square foot and basket size to confirm the store pays for its space.
Watch adoption rate and transaction time to see if staff and patients use the store easily.
Review staff time reclaimed and after-hours utilization to show how the store helps around the clock.
Operational KPIs
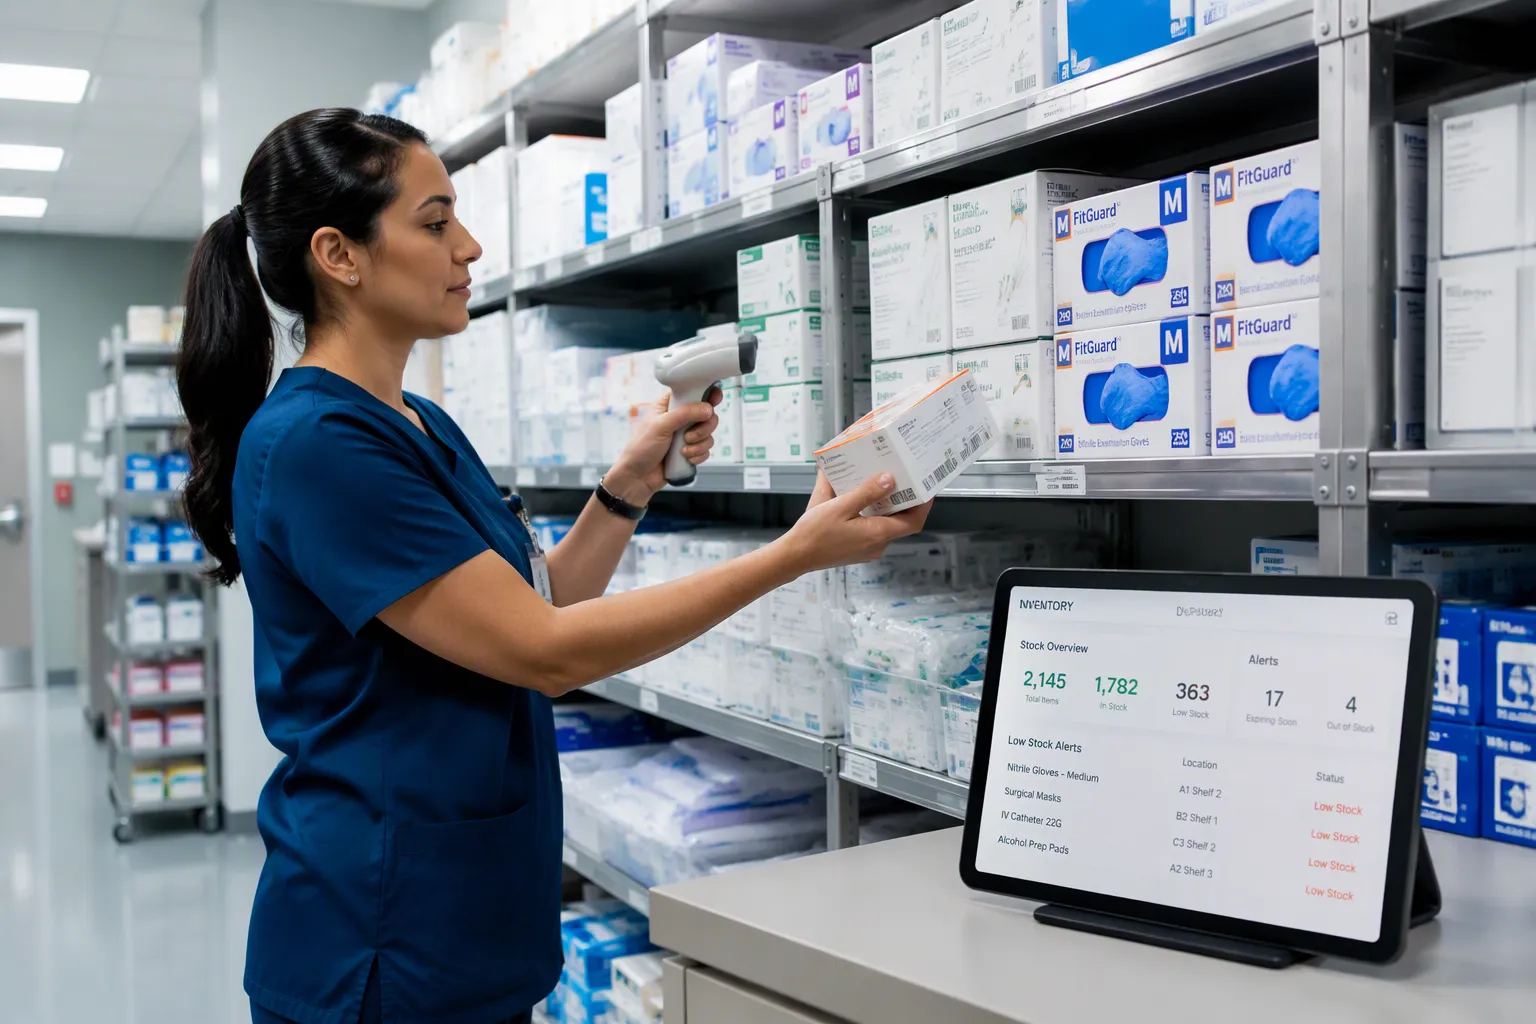
Operational metrics reveal whether an autonomous store delivers the right item at the right moment. Stockout rate and inventory accuracy form the foundation of this group. Both metrics expose weaknesses before they reach a patient. Each metric answers a practical question about daily store health.
Stockout Rate
Stockout rate measures the share of requested items that are unavailable when a user needs them. This metric matters most in a clinical setting. A missed item can delay patient care, force a nurse to leave the floor, or interrupt a procedure. Hospitals cannot treat a missing item as a minor inconvenience. They must treat it as a care risk. A store that misses a glove size or a catheter kit sends staff searching elsewhere. That search costs time and pulls attention away from patients.
Autonomous retail benchmarks give store operators a reference point. Well-run systems keep stockout rates low through continuous shelf monitoring and rapid restocking. Operators should set internal targets and review exceptions daily. A rising stockout rate on critical supplies signals a replenishment problem, not a demand problem. The fix usually sits in reorder points, par levels, or delivery schedules.
Inventory Accuracy
Inventory accuracy rate compares recorded stock against physical stock. Stock replenishment efficiency measures how quickly the store returns to optimal stock levels after a sale or a demand spike. Both metrics drive order fulfillment speed. Accurate inventory management eliminates waste and redundant activities, which streamlines processes and results in faster order fulfillment and reduced lead times. When stock levels are optimized through accurate demand forecasting and inventory management software, hospitals avoid overstocking and stockouts. Automation further accelerates fulfillment by processing requests rapidly and reducing the time for supplies to reach the hospital.
Benchmarks vary by method. Manual picking carries an error rate of roughly 1–3%, while automated systems hold error rates at 1% or less. The ASCM best-in-class order accuracy benchmark sits at 99.5–99.9%. Manual distribution center inventory accuracy typically falls between 85–95%. Autonomous systems target 99%+ within 90 days, and ground robot scanning accuracy reaches 99.9%. Operators should compare their own numbers against these ranges and set a realistic improvement path.
"we're pushing upwards of 99.9% accuracy" — a figure that dramatically outperforms manual counting.
Verity drones are reported to achieve 99.994% reliability across retail, 3PL, and manufacturing deployments. Predictive inventory management and supply chain optimization help teams sustain these levels. Centralized, accurate data lets teams save hours of manual work, eliminate duplicate processes, and make faster, more confident decisions.
Vendor performance indicators support these operational kpis. Delivery timeliness shows whether a vendor meets agreed schedules. Service responsiveness shows how quickly a vendor resolves problems. An unreliable vendor causes delays and downtime while teams wait for resolution. Strong vendors communicate early and resolve issues proactively. Review these indicators monthly and rank vendors by reliability. These indicators belong on the same dashboard as stockout rate and inventory accuracy, because supply chain operations depend on reliable partners for medical supplies ordering. A store that tracks vendor performance alongside stock data catches problems earlier and protects medical supplies availability for every shift.
Efficiency and Uptime KPIs
System Uptime
System uptime measures the share of time the store operates without failure. This metric carries real weight in a clinical setting. A store that goes dark at 2 a.m. leaves the night shift without supplies. Operators should track uptime continuously and log every outage with its cause, duration, and impact on care. A pattern of short outages often points to network instability or a failing sensor. A single long outage usually points to a hardware fault or a power problem.
Uptime data also supports vendor accountability. When a payment terminal or a camera module fails, the operator can show the vendor exactly how much selling time was lost. Review uptime weekly and set a threshold that triggers escalation. Escalation should name a responsible contact and a response window. A clinical facility cannot afford a store that works most of the time. They need one that works every shift.
Shrinkage Rate
Shrinkage rate measures the value of stock lost to theft, spoilage, misplacement, or recording error. Autonomous stores reduce some shrinkage sources and expose others. Computer vision and weight sensors catch discrepancies that manual counts miss. Spoilage still occurs when perishable items sit too long on the shelf. Misplacement still occurs when a user returns an item to the wrong slot. A missing item and a stolen item look the same in a total, yet they call for opposite responses. Each cause demands a different remedy, so a blended figure hides the real problem.
Operators should break shrinkage down by cause rather than track a single blended number. A rising spoilage share calls for tighter par levels on perishables. A rising theft share calls for a review of entry controls and camera coverage. Track shrinkage monthly and compare it against inventory accuracy figures. The two metrics share a root cause, so a fix in one area often improves the other. These kpis give hospitals a clear view of where stock disappears and why.
Financial and Key KPIs
Revenue Per Square Foot
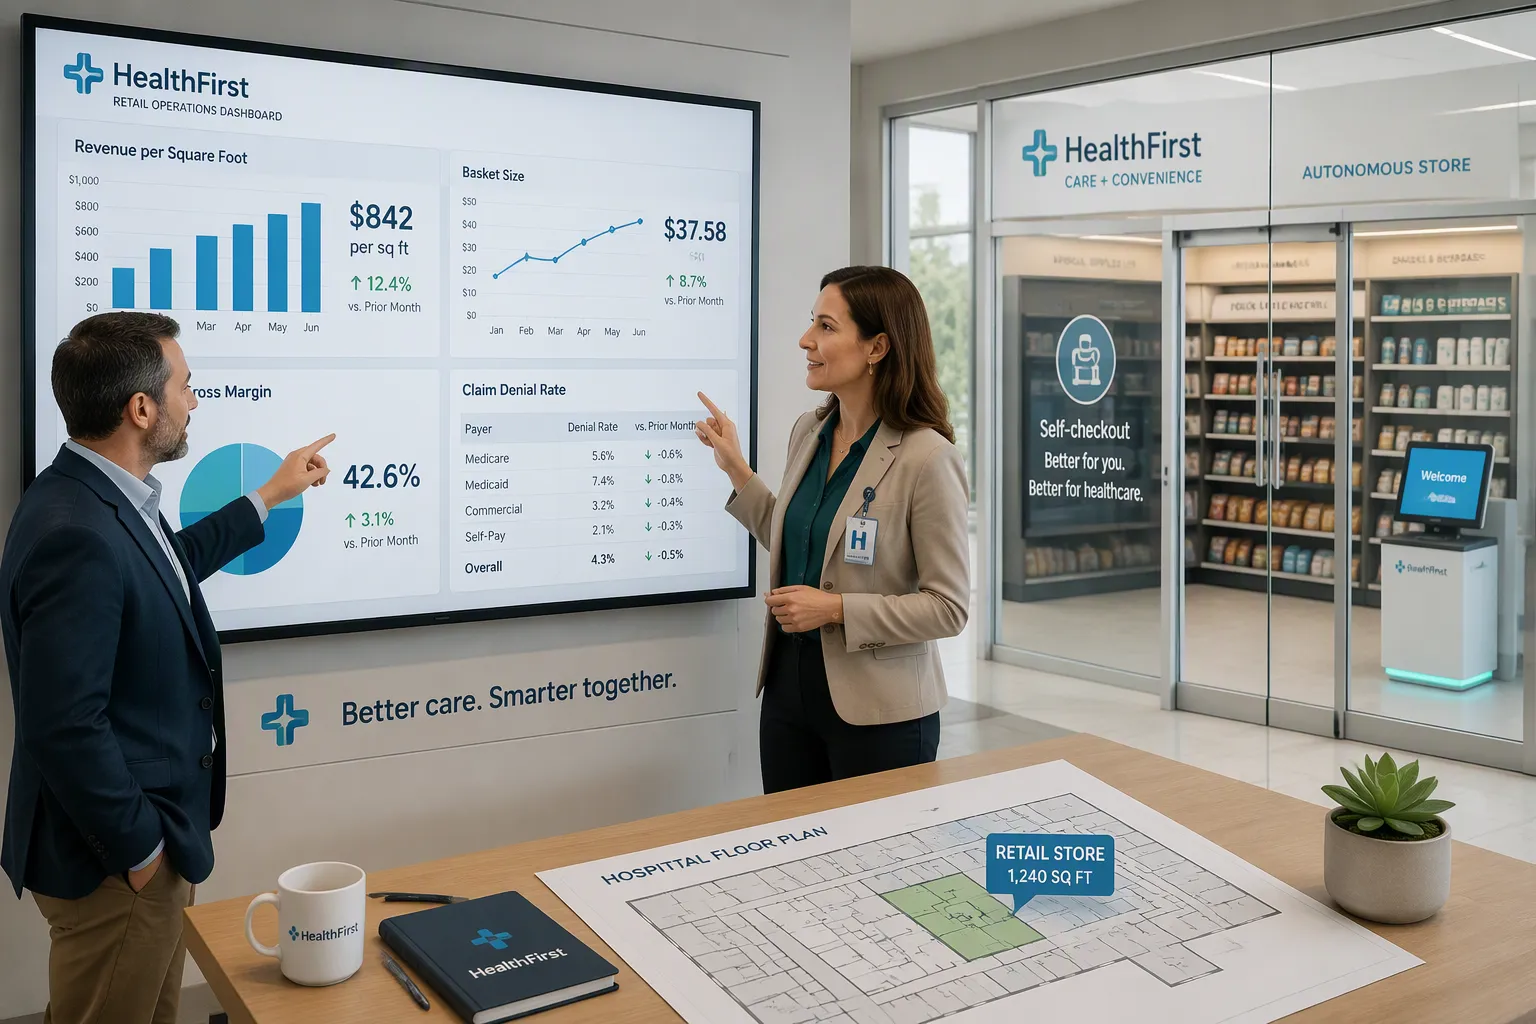
Revenue per square foot divides total store sales by the floor area the store occupies. Hospital space carries a high opportunity cost, so this ratio tells healthcare cfos whether a store earns its footprint. A store tucked beside a cafeteria competes with food service revenue. A store near a supply closet competes with central distribution. Leaders should compare the ratio across locations and across shifts. A store that underperforms on the day shift may still justify its space through night coverage.
Autonomous store revenue also touches hospital revenue cycle reporting. Store charges for patient-facing items must land in the correct account, or they distort the financial picture. Revenue cycle kpis and key revenue cycle kpis act as bridge metrics here. They connect retail transactions to the billing system and show whether charges flow cleanly. Revenue cycle management teams should review these kpis alongside store sales each month. Strong revenue cycle management keeps store revenue visible and auditable.
Basket Size and Gross Margin
Basket size measures the average value per transaction. Gross margin measures the share of revenue left after the cost of goods. Together they show whether the store sells enough per visit and prices items correctly. A small basket with a healthy margin may suit a grab-and-go format. A large basket with a thin margin may signal pricing pressure or costly spoilage.
Claim denial rate belongs in this discussion. Unattributed or misclassified store charges can surface as claim denials, and each denial erodes margin. Revenue cycle management kpis help teams spot the pattern early. Denial analytics and advanced revenue cycle analytics trace a denied charge back to its source transaction. Clean claim rate and net collection rate then confirm whether the fix worked. Healthcare cfos should watch claim denials tied to store charges, because a clean claim rate protects margin as surely as a good price does. Days in accounts receivable and patient collection rate round out the picture. Revenue cycle management improves when clean claim rates rise and claim denials fall.
Payback period and capital expenditure reporting complete the financial view. Payback period divides the store's upfront cost by its monthly net contribution. Healthcare cfos should report store assets as capital expenditure and track depreciation separately. Rcm performance metrics and the metrics above belong on one dashboard, so financial performance stays tied to billing accuracy.
Customer Experience KPIs
Adoption Rate
Adoption rate measures the share of eligible staff and patients who use the store within a given period. A store can run perfectly and still fail if people walk past it. Operators should split adoption by user group, because a nurse on a night shift and a visitor in a waiting area bring different needs. A low rate among one group points to a placement, access, or awareness problem rather than a technology fault.
The metric also tracks repeat use. A first-time visitor who never returns signals a friction point somewhere in the journey. Operators should pair adoption with a simple question: did the user find what they needed? A store that attracts many first visits and few second visits has an experience problem, not a marketing problem. Review adoption monthly and compare it against the store's opening baseline.
Transaction Time and Satisfaction
Transaction time measures how long a user spends from entry to exit. Speed drives satisfaction in autonomous formats, and the numbers are stark.
Metric | Finding | Implication for satisfaction |
|---|---|---|
Shoppers valuing checkout experience | 84% rate it very important or important in shopping decisions | Checkout speed is a decisive satisfaction driver |
Consumers abandoning stores due to long waits | 86% over 12 months | Slow transactions drive dissatisfaction and lost sales (~$38B) |
Lumen Field autonomous store deployment | Sales more than doubled vs. prior stand; fan satisfaction scores hit an all-time high | Faster, seamless transactions correlate with record satisfaction |
Long checkout lines are a major consumer pain point, and grab-and-go formats remove them. The benefits form a chain: faster transactions lead to reduced waiting times, which lead to improved satisfaction. Zach Hensley of Lumen Field observed a dramatic throughput increase, less congestion, and a steadier flow at full capacity. Over half of consumers actively seek the autonomy and efficiency of self-checkout kiosks. Operators in hospitals should track transaction time alongside a short satisfaction survey, then watch both together. A falling transaction time with flat satisfaction suggests speed alone is not the whole story.
Staff and Patient Impact KPIs
Staff Time Reclaimed
Staff time reclaimed measures the hours that nurses and other employees save when they no longer walk to a supply room or wait in a checkout line. This metric translates store performance into workforce capacity. A store that sits close to the unit removes long trips from the shift. Operators can estimate the gain by tracking trip frequency before and after deployment. They can also survey staff about the time they recover each week.
The value of this metric extends beyond convenience. Every minute a clinician spends hunting for supplies is a minute away from patient care. Hospitals should treat reclaimed time as a care metric, not just an efficiency metric. Review the figure quarterly and compare it across units. A unit that reports little gain may need a better store location or a wider product mix.
After-Hours Utilization
After-Hours Utilization tracks store activity during nights, weekends, and holidays. These are the hours when central distribution closes and staffing runs thin. A store that performs well at 3 a.m. proves its worth in a way daytime sales cannot. Operators should measure transaction volume and item mix by hour, then compare night demand against day demand.
Strong after-hours use also protects patients. A visitor who needs a basic item at midnight avoids a trip off campus. A nurse who needs a dressing change kit avoids a delay. Hospitals should set a baseline for off-shift activity and watch for sudden drops. A falling night volume may signal an access problem or a stocking gap. These kpis belong beside the operational and financial metrics, because they show whether the store serves every shift, not just the busiest one.
The most critical key kpis connect across all four categories. Inventory accuracy drives stockout rate and shrinkage at once. ABC analysis and Min/Max levels keep fast-moving items stocked, and a reorder point set correctly prevents shortages through structure rather than reaction. One retail director noted that shelf-monitoring robots cut out-of-stocks sharply. Revenue cycle kpis and revenue cycle management tie store sales to clean billing, so healthcare cfos see true margin.
Hospitals should start with a small dashboard, set baselines, and review exceptions monthly. Healthcare cfos can then scale stores across facilities, using inventory management and supply chain optimization data while keeping regulatory compliance intact.
FAQ
How many KPIs should a hospital track at launch?
A launch dashboard should hold a handful of metrics, not dozens. Stockout rate, inventory accuracy, system uptime, and shrinkage rate cover daily store health. Adoption rate and staff time reclaimed show whether the store earns its place. Leaders can add financial metrics once baselines exist.
What stockout rate should a hospital store target?
The article sets no universal figure, so operators should set internal targets and review exceptions daily. A rising stockout rate on critical supplies points to a replenishment problem. The fix usually sits in reorder points, par levels, or delivery schedules rather than in demand.
How does inventory accuracy affect shrinkage?
Both metrics share a root cause. Misplacement and recording error inflate shrinkage and depress accuracy at the same time. A fix in one area often improves the other. Operators should break shrinkage down by cause, because spoilage and theft call for opposite responses.
Why does claim denial rate belong in a store KPI review?
Unattributed or misclassified store charges can surface as claim denials, and each denial erodes margin. Revenue cycle teams should trace a denied charge back to its source transaction. Clean claim rate and net collection rate then confirm whether the fix worked.
How often should leaders review these metrics?
Daily review suits stockout exceptions and uptime incidents. Monthly review suits shrinkage, adoption, vendor performance, and financial metrics. Quarterly review suits staff time reclaimed and after-hours utilization. A fixed cadence keeps the dashboard useful instead of noisy.
See Also
Why Stores Powered By Artificial Intelligence Represent The Future
How Artificial Intelligence E-Commerce Tools Transform Online Store Management
Exploring Walgreens Self-Checkout: Convenience And Challenges In Retail
The Rise Of AI-Powered Corner Stores: What Retailers Must Know
Micromarkets Versus Smart Stores: How Automated Convenience Retail Works Worldwide
