Which Is the Best Choice for Retail Inventory Computer Vision or RFID

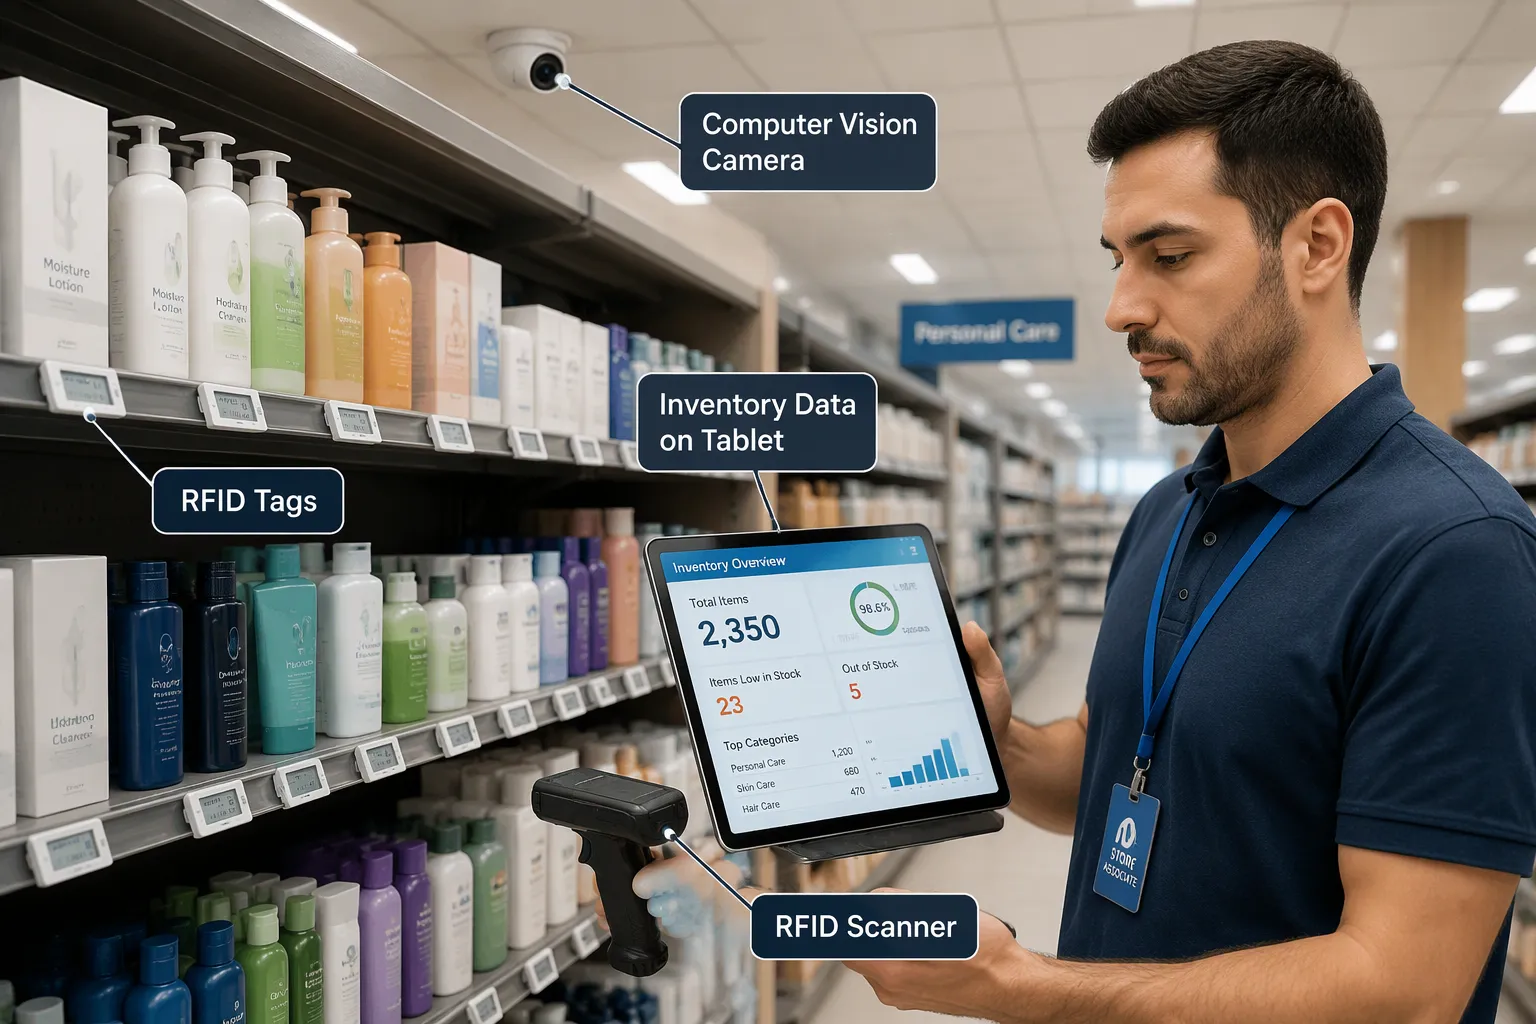
No single answer works for every store. The best choice between computer vision and RFID depends on store format, product mix, budget, and inventory goals. Both technologies aim for the same results: accurate stock counts, fewer labor hours, lower shrink, and better shelf availability. RFID tags every item and reads its identity electronically. Computer vision uses cameras and AI models to see products on shelves. Each approach performs differently across retail environments. Performance, fit, compliance demands, and total cost decide the winner for a given operation. The comparison below, including a computer vision vs RFID in retail – scenario 12 walkthrough, gives readers a clear basis for choosing with confidence.
Key Takeaways
Pick RFID for items with tags and quick counts; pick computer vision for goods without tags and shelf checks.
RFID reads tags using electronics, not by needing to see them. This gives you accurate inventory down to each item.
Computer vision uses cameras and AI to watch shelves all the time, and it does not need a tag on each item.
Think about the kinds of products you sell, the type of store you have, and how much money you can spend before you choose a technology.
Try a small test on one task to compare results and costs side by side.
The total cost includes hidden costs, such as the work of tagging items and training the model.
Hybrid systems mix RFID identity with camera shelf context to get a fuller picture.
Both technologies can work together, and the best choice depends on what your store needs.
RFID vs Computer Vision: The Short Answer
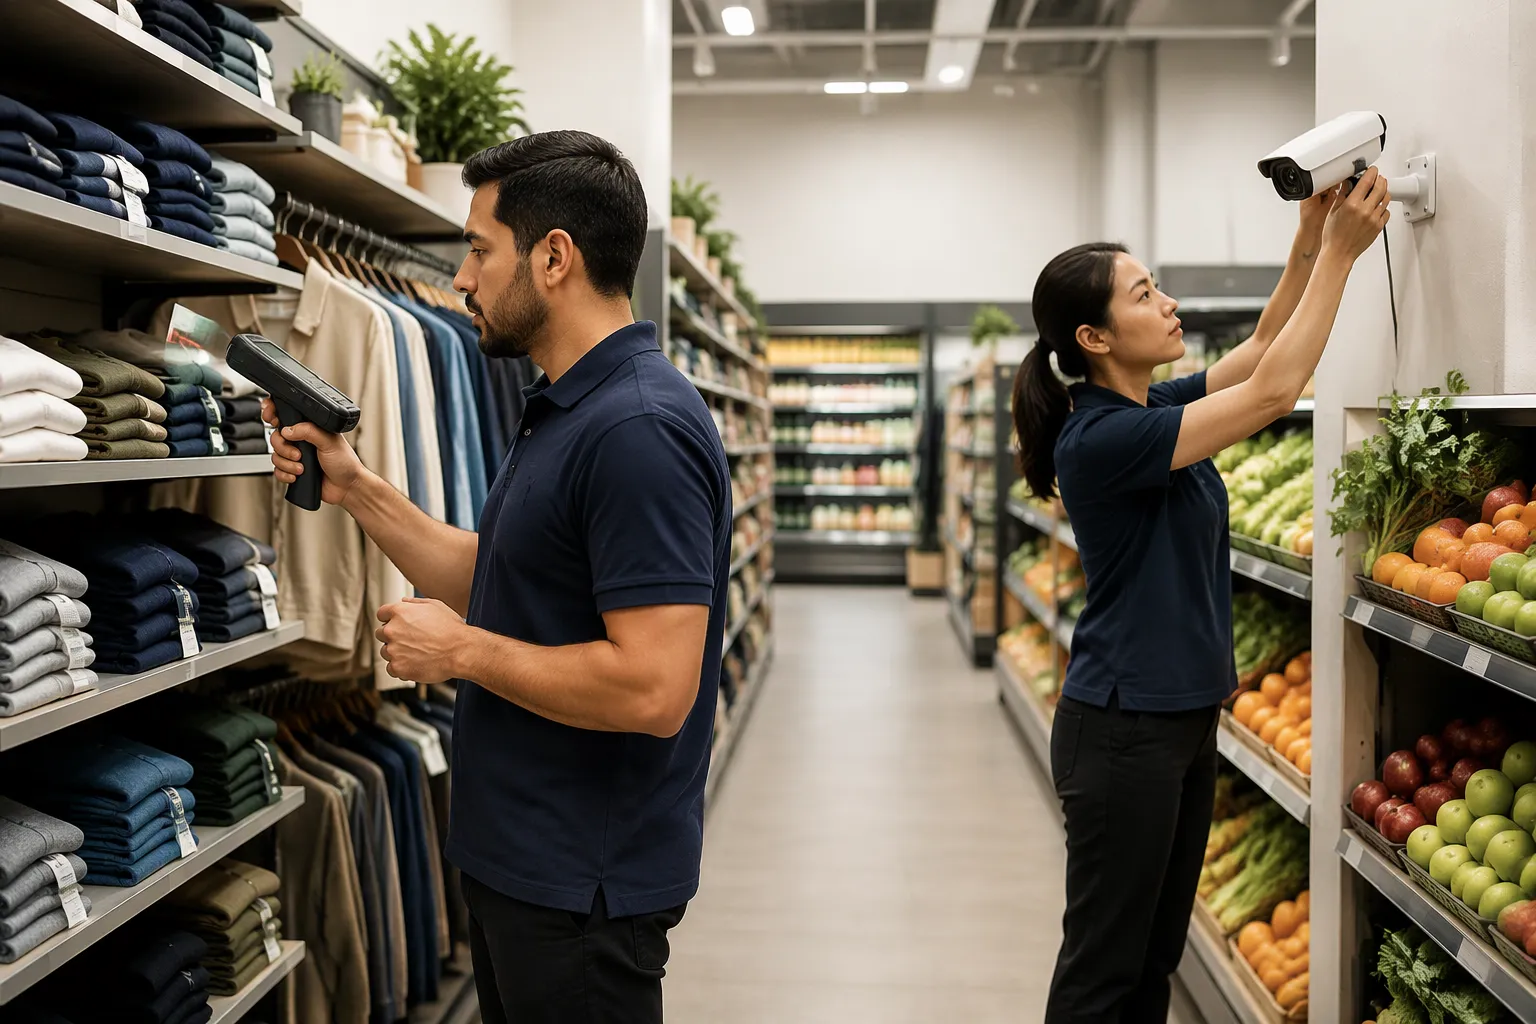
Neither technology wins in every case. The right pick depends on product mix, store format, and inventory goals. A quick comparison: RFID vs computer vision comes down to what each system can observe and what it costs to observe it. RFID creates an electronic identity event when a tagged item passes a reader. Computer vision interprets what a camera can see. Either approach can support inventory tracking, and each one fits a different set of conditions.
Why Context Decides
Store format shapes the decision first. A large apparel floor with thousands of tagged units rewards fast, hands-off counting. A grocery aisle full of fresh produce and loose goods offers no reliable tagging point. Product mix matters just as much. Unit economics decide whether a tag on every item makes sense. Goals set the final filter. A retailer that needs shelf-level visual insight asks a different question than one that needs a fast, accurate cycle count. The same quick comparison: RFID vs computer vision therefore produces different answers for different operators.
Key Decision Factors
Five factors carry most of the weight. Accuracy depends on tag reliability for RFID and on model quality for vision systems. Tag requirements split the two sharply. RFID needs a suitable tag and an encoding process. Computer vision may use existing visual features, but labels and presentation must remain recognizable. Cost structure differs in shape, not just size. Automation level separates periodic reads from continuous observation. Best-fit scenarios follow from all four.
Side-by-Side Comparison
The table below summarizes the trade-offs.
Factor | RFID | Computer Vision |
|---|---|---|
Accuracy | High when tags read reliably; sensitive to read environment | Depends on model training, lighting, and occlusion |
Tag requirements | A suitable tag and encoding process on every item | No per-item tag; labels and presentation must stay recognizable |
Cost structure | Tags, printing or encoding, applicators, readers, antennas, site surveys, mounting, middleware, integration, tag replacement | Cameras, lenses, lighting, mounting, networking, processing, data storage, model development or licensing, monitoring, retraining |
Automation level | Automatic reads at gates and handheld sweeps; periodic snapshots | Continuous observation with no scan required |
Best-fit scenarios | Tagged, high-volume, fast-count categories | Untagged, visual, shelf-level monitoring |
Both columns share one cost that buyers often miss. Exception handling applies to either system. Staff must investigate missed reads, duplicate events, blocked cameras, damaged tags, or stock mismatches. ASIARFID notes that low device cost can still produce high operating cost when events remain uncertain.
Automation deserves a closer look. Deep learning models trained on warehouse environments recognize pallets, cartons, individual SKUs, labels, and barcodes, according to iFactory. The system counts stock visually with no tags, no barcode dependency, and no contact scanning. Inflow Inventory makes a similar point. Computer vision observes inventory as it moves, so operators get continuous visibility instead of periodic snapshots from scans or manual cycle counts. SupplyChainBrain reports that cycle counting which once took days can finish in hours, and inventory accuracy frequently exceeds 98% to 99%. Each system automates a different step. RFID automates identification. Computer vision automates observation.
That distinction frames the whole RFID vs computer vision decision. RFID answers "what is this item?" Computer vision answers "what does the shelf look like?" A store that needs the first answer should weigh tags and readers. A store that needs the second should weigh cameras and models. Many stores need both answers, and the sections that follow show where each one fits.
How RFID Inventory Tracking Works
Tags, Readers, and Events
A passive RFID tag stores a unique ID on a small chip hooked to an antenna. The tag has no battery. A reader sends out a radio signal, and the tag answers with a radio response that carries its serialized identity. The reader records that exchange as an electronic identity event, with a timestamp and a location. No line of sight is needed, and staff do not scan items one by one.
This event stream is the heart of rfid inventory tracking. Each read links a unique identifier to a moment in time, so the system builds a live record of what is on hand. Understanding how rfid inventory tracking works starts with this idea: the tag supplies item-level identification, and the reader turns that identity into data the inventory system can act on.
Strengths and Accuracy
Accuracy is the main strength. Research from the Auburn University RFID Lab shows that retailers using RFID often reach 95 percent or better inventory accuracy. Vendor reporting goes higher. RFID Cloud describes rfid technology reaching accuracy rates of 99.98 percent and above, while Taylor notes retail companies reporting more than 99 percent against an industry standard of 65 percent. Treat vendor figures with care, but the direction is consistent.
Speed adds to the gain. A handheld sweep reads hundreds of tags in seconds, so a full stock count takes minutes instead of hours. The system also catches misplaced items, because every read confirms presence rather than assumption.
Limits and Tag Costs
Cost per item is the main constraint. Camcode reports passive RFID tags at about 5 to 15 U.S. cents per chip, with special housings for metal interference costing more. CP Congroup puts apparel inlays at $0.05 to $0.08 per tag across millions of SKUs, and notes that the real challenge in retail is not tag cost but the infrastructure investment in fixed reader portals and inventory management software. Finale Inventory lists readers at $500 to $3,000 each and implementation services at $10,000 to $100,000 or more.
Read environment matters too. Metal and liquid can weaken signals, and dense stacks can block reads. Range is finite as well. As Qash puts it:
What is significant is that unlike GPS, RFID can’t be tracked or pinpointed over large distances.
These limits are manageable with site surveys and the right tag form factor. They simply belong in the plan.
Where RFID Inventory Tracking Fits Best
RFID is a strong choice for organized inventory control. It works best when every item has a tag and the store needs fast, repeatable counts. In these settings, workers treat rfid inventory tracking as a basic tool, not a test.
High-SKU, High-Volume Stores
Big stores with thousands of SKUs gain the most from item-level reads. A handheld sweep grabs hundreds of tags in seconds, so a full count takes only minutes. Staff scan less and spend more time on the floor.
High volume also makes the event stream useful. Each read proves an item is there, so the system finds misplaced units before they turn into lost sales. That reliability helps with efficient inventory management across busy selling floors.
Apparel and Case-Level Logistics
Apparel and footwear work well with RFID. A tag fits inside a hangtag or label, and the read does not need a direct line of sight. A folded shirt in a stack still answers the reader.
Case-level logistics work the same way. Retailers can count cartons at receiving and track them through the backroom. FineLine Technology notes that RFID tracks products from manufacturer to store, which helps spot weak points where losses happen during transport or storage.
Compliance and Loss Prevention
Retailers now want to understand loss across the whole operation, and RFID gives them the data. CoreSight Research breaks the value into three parts:
Identification and location — Each tag holds an electronic product code that links an item to its SKU and item number. A reader shows which items are in the store and roughly where.
Movement across a boundary — Antennas above entrances and exits record departures. A front-door exit may mean a purchase or a theft; a back-door exit may point to employee theft. CoreSight notes passive tags usually reach less than 30 feet.
Existence or absence — Antennas pick up items still inside. An item scanned before that no longer shows up counts as missing, and the system flags a return attempt on a unit marked missing.
FineLine Technology adds that exit gates alert staff when an unpaid item leaves, and the system names the exact product taken. The same EPC or TID data traces merchandise found outside authorized channels, which helps with authentication and return checks. These features give retailers a clear picture of what causes shrink, not just a count of losses.
How Computer Vision Works in Retail
Cameras, Models, and Analytics
Cameras placed above shelves, at entrances, or on robots take pictures of the sales floor. An AI model then finds products, empty spots, and shelf conditions. You do not need a tag on each item. The software reads each image or video and turns it into a stock signal. That signal goes to the inventory system without any scanning.
This is how computer vision tracks inventory in real life. A model trained on store images learns to spot packaging, facings, and empty slots. Analytics then check the shelf against the planogram. Staff get an alert when a product runs low or sits in the wrong spot. The loop runs all the time, so the record stays current between counts.
Strengths and Automation
People often call computer vision more cost-effective because it captures products without tagging every item. Stores avoid the per-unit tag cost and the encoding work that goes with it. The approach also offers a level of automation that has no equal. Cameras watch the shelf all day, and the model reports what it sees.
That constant view changes how computer vision tracks inventory. Counts no longer rely on a scheduled sweep. The system spots a gap the moment it appears. Store teams act on fresh data instead of a snapshot from last week. For categories without tags, this is the main advantage.
Limits and Compute Needs
Accuracy depends on image quality. SciForce lists poor lighting, hidden details, object variations, and cluttered backgrounds as common challenges. NovaCloud notes that accuracy drops when shelves are cluttered, lighting changes, or SKUs look too much alike. Calibration and retraining therefore matter.
Occlusion is a second problem. Chooch explains that occlusion happens when another object hides part of a target, and systems may struggle to track partly hidden items over time. Hardware helps. Infrared sensors and depth cameras capture details that lighting does not affect. Compute adds cost as well. SCN Soft reports custom computer vision software for inventory counting at $150,000 to $400,000 or more, with hardware from $120 to $2,000 or more depending on the device.
Where Computer Vision Fits Best
Computer vision is a good fit where you can't put tags and where shelf conditions matter as much as stock counts. Three settings show this pattern most clearly.
Shelf and Planogram Monitoring
Planogram compliance is a natural fit. A model compares a shelf image, called a realogram, against the reference planogram. It finds products, sorts them, and groups them by row. Each product then gets a status such as correct, wrong position, wrong shelf, or out-of-stock. A Nature study describes this process running across more than 7,000 7-Eleven locations in Taiwan, where staff photograph a shelf and get compliance feedback through a mobile or web app.
The operational payoff can be measured. Proceso reports that AI capabilities in planogram compliance can cut audit cycle time by up to 70 percent. Its YOLOv11-based system scores each shelf and auto-approves layouts that reach an acceptable standard of up to 80 percent. If not, it returns corrective guidance such as "Row 3 missing SKU." The same visual data supports shelf-availability monitoring and in-store behavior insight, so one camera feed serves several teams.
Fresh and Untagged Categories
Fresh departments resist tagging. Loose produce, bakery goods, and deli items have no practical place for a chip. Computer vision handles them through recognition instead. Malong Technologies offers AI Fresh, which identifies fresh products on a self-serve scale automatically. The same company's AI Cabinets recognize products without any tag at all.
These categories also change too fast for periodic counts. A produce bin empties and refills within hours. A camera watching the shelf catches the gap as it forms. Staff restock based on evidence rather than guesswork, and shrink from spoilage falls because the team sees slow-moving items sooner.
Camera-Rich Store Formats
Stores that already run dense camera networks gain the most. Amazon Go opened in 2018 as the first unmanned retail store open to the general public. Dozens of CCTV cameras there use deep learning to detect customer behavior and identify the products they pick up. Shelf and cart sensors work alongside machine vision and AI to complete the picture.
Computer vision is often considered more robust and versatile for product detection in some settings. It reads packaging, orientation, and layout quality without touching the item. The caution is honest: fully automatic product detection has seen fewer successful deployments than machine-vision object recognition systems overall. Camera-rich formats shorten that gap, because the hardware and coverage already exist. The model adds interpretation on top of infrastructure the store has paid for.
Computer Vision vs RFID in Retail – Scenario 12
Two worked examples show how the same decision factors can lead to different answers. Each case below uses the computer vision vs RFID in retail – scenario 12 logic for a different store format.
A Mid-Size Grocery Scenario
A mid-size grocery chain wants fewer out-of-stocks in its center aisles. Loose produce and deli goods have no tag, and staff turnover makes daily handheld counts unreliable. The team already has cameras over every aisle for security. Here the computer vision vs RFID in retail – scenario 12 comparison favors cameras. A vision model reads shelf facings, flags empty slots, and checks planogram compliance without tagging a single item. The existing camera network covers most of the hardware cost.
Tagging every grocery SKU would add a per-item cost across thousands of low-margin units. Instead, the chain tests vision on one category, measures shelf availability for a month, and compares the result against its manual baseline.
An Apparel Chain Scenario
An apparel chain needs an accurate count of folded stock across forty stores. Every garment can carry a hangtag, and staff currently spend hours on cycle counts. The same computer vision vs RFID in retail – scenario 12 framework points the other way. A handheld reader sweeps hundreds of tags in seconds, and the chain reaches item-level accuracy without a camera on every fixture.
The tag cost stays small compared with the price of a garment, and the event stream catches misplaced sizes before they become lost sales. The chain tests RFID in one store's stockroom, tracks count time and accuracy, and expands only if the numbers hold.
What the Scenarios Reveal
The grocery case rewards observation without tags. The apparel case rewards identity on every item. Neither outcome proves one technology is better. Each result comes from product mix, existing infrastructure, and the task at hand. The computer vision vs RFID in retail – scenario 12 method simply makes that fit visible before a chain commits capital.
A third path also exists. A retailer with tagged apparel and camera-covered aisles can run both systems and reconcile the data. The scenarios therefore point to fit, not superiority. The next section looks at hybrid systems in more detail.
Hybrid Systems: When Both Add Value
Tag Data Plus Visual Checks
RFID identity events and computer vision interpretation can work as a team. A tag confirms that a specific item is present. A camera confirms how that item sits on the shelf. Together they close gaps that either system leaves open alone. A hybrid rfid and vision system links each electronic identity event to a visual record, so staff see both the item and its condition.
Industry experts note that retailers may need barcode, RFID, and vision systems together to meet business objectives. No single technology covers every task. A hybrid approach lets each tool handle the job it does best. Tags supply item-level identity. Cameras supply shelf context. The combined data gives a fuller picture than either stream alone.
Practical Hybrid Scenarios
A hybrid rfid and vision system fits stores that already run both infrastructures. An apparel retailer with tagged garments and aisle cameras can match each read to a shelf image. The system flags a tagged item that sits in the wrong location. Staff fix the placement before a customer misses it.
The RFIDHY analysis of machine vision challenges shows why pairing helps. Occlusion and low contrast can hide parts from cameras, and manual re-inspection can raise labor costs by up to 30 percent. A tag read confirms presence even when a camera cannot see the item. High-speed misreads on fast conveyors cost manufacturers more than $10,000 per hour in scrap, per RFIDHY. Tag events catch items that cameras miss at speed.
Challenge | Issue | Cost Impact |
|---|---|---|
Occlusion and Low Contrast | Parts obscured by shadows, grease, or overlapping objects can evade camera detection | Manual re-inspection can increase labor costs by up to 30% |
High-Speed Misreads | Cameras struggle to capture fast-moving items on conveyors | False rejects or undetected defects cost more than $10,000 per hour in scrap |
Limited data capacity | Barcodes or QR codes lack storage space for historical data | Untraceable parts cannot pass FDA or IATF 16949 audits |
Surface dependency | Reflective or textured surfaces confuse vision algorithms | Frequent recalibration can reduce uptime by 15-20% |
Integration Considerations
Integration demands practical work. Data reconciliation comes first. The team must match tag events to camera observations and resolve conflicts. A tag read with no visual match needs review. A visual detection with no tag needs the same.
Workflows must change as well. Staff need clear steps for handling exceptions from either system. Training should cover both the reader tools and the camera dashboards. The LinkedIn analysis of Amazon Go notes that deploying new technologies carries a high initial capital investment, even when it reduces future labor costs. Retailers weighing a hybrid rfid and vision system should plan for that upfront spend and for the training that follows.
Total Cost of Ownership
Upfront Costs
The total cost picture starts with hardware and software. A tag-based setup pays for labels, readers, antennas, and the encoding equipment that writes each chip. A computer vision setup pays for cameras, lenses, lighting, servers, and software licenses. Cloudpick notes that vision systems also need GPU acceleration for real-time video analysis and edge computing to reduce bandwidth needs. Installation and integration expenses add to both columns. Buyers should compare these line items side by side before choosing, because the two systems spend their money in different places.
The upfront gap often favors vision on paper. Cameras cover a whole aisle, while labels attach to every unit. PatSnap reports that rfid carries higher initial costs but lower operational expenses through reduced labor, minimal maintenance, and fewer errors. That trade-off shapes the rest of the calculation, and it explains why a cheap-looking quote can hide a costly five-year run.
Ongoing Costs
Consumables drive the recurring bill for tag-based systems. Every new product needs a fresh label, and stock must be replenished as it runs low. Cloudpick lists standard dry inlays at $0.04 to $0.08 per unit, with on-metal or hard tags at $0.50 to $2.00 or more. Vision systems carry no per-item consumable, but cameras need cleaning and occasional replacement, and storage systems expand as data grows.
Maintenance and compute belong in this column too. PatSnap finds that rfid break-even points typically arrive between 18 and 36 months, depending on asset quantity and tracking frequency. High-volume environments favor the technology over the five-year horizon. Vision systems spread their cost across software subscriptions and service contracts that renew every one, three, or five years, per Cloudpick. Neither path is free after installation.
Hidden Costs
The costs that surprise buyers rarely appear in a vendor quote. Cloudpick estimates that a mid-sized retail operation processing 50,000 items daily needs 8 full-time equivalents for tagging labor. At $45,000 per employee annually, that totals $1.8 million over five years. Vision systems avoid that team but add integration work, model training, and change management.
Hidden Cost | Tag-Based | Computer Vision |
|---|---|---|
Tagging labor | 8 FTE; $1.8 million over five years | No tagging team |
Consumables | Labels replenished as stock runs low | None |
Maintenance | Active labels need battery replacements | Cameras cleaned and replaced |
Support fees | Monthly, semi-annual, annual fees accumulate | Software subscriptions continue |
Integration, training, and change management apply to both paths. Staff must learn new workflows, and data must reconcile across systems. These items rarely show up in a headline price, yet they decide the real total cost. Training alone can consume weeks of staff time across multiple stores, and change management never ends at go-live. A careful buyer budgets for them from day one and treats them as part of the decision, not an afterthought.
Run a Task-Based Pilot
A pilot gives you real proof from your own store. The method is simple: choose one task, set the numbers that show success, then compare results side by side. HudaSoft suggests testing the use case with the highest ROI in two or three stores for 90 days. A narrow scope keeps the measurement clear and the risk small.
Pick One Task
Begin with one job you can measure. Counting one category works well, because the team can count the same shelves before and after the change. Checking shelf availability on one aisle is another good choice. The task should matter to the business and stay small enough to finish during the pilot.
Don't mix several goals into one test. A pilot that chases counts, shrink, and planogram compliance all at once gives you muddled data. One task gives the team a clean baseline and a clean result.
Define Metrics
Set the metrics before the first scan. HudaSoft lists on-shelf availability rate, shrinkage percentage, checkout throughput, staff hours on manual tasks, model accuracy, alert precision, and false positive rate as useful measures. Pick the three or four that match your chosen task, and record the current baseline for each one.
Published results show how much change a pilot can capture. One retail deployment reported pricing errors down 75 percent within six weeks, and store teams got back 15 to 30 labor hours per week, according to Claudio Blandsberg on LinkedIn. The same account cites up to 24 percent improvement in on-shelf availability excellence within three months and an average 56 percent cut in audit time. These figures give the reader a reference point, not a promise.
Compare and Scale
Run both approaches on the same task when budget allows. Compare item counts, labor hours, and cost per count on one page. A vision test and a tag test on the same category show which system fits the store's product mix.
Scale only what proves out. If the pilot hits the agreed thresholds, extend it to more stores. If accuracy drops below those thresholds, HudaSoft advises quick retraining and monitoring. A failed pilot costs far less than a failed rollout, and the data guides the next decision.
Decision Framework
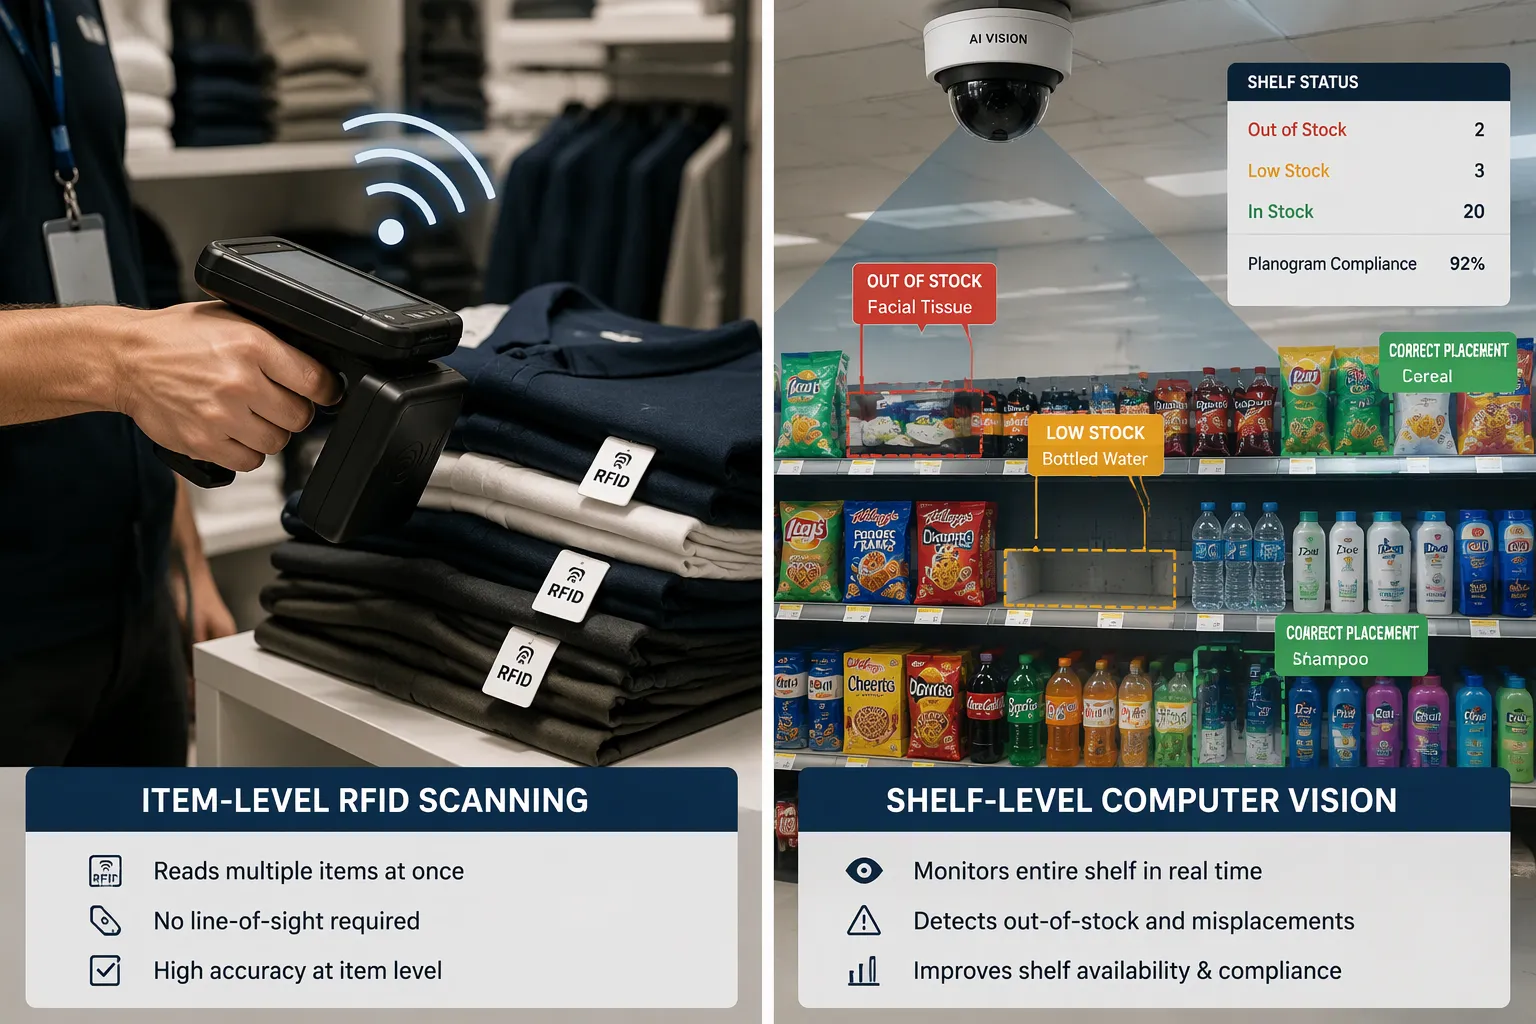
The framework below turns the earlier comparison into a practical test. Each question points toward one technology, and the answers add up to a clear recommendation. Qingo explains the split simply. RFID suits closed-loop settings where a tag cost is small compared with the item value, such as IT assets, expensive medical supplies, or specialized industrial tools. Computer vision suits high-volume, standard retail environments, where snacks, fresh food, beverages, and daily necessities reward visual shelf insight.
When to Choose RFID
RFID is the better fit when products already carry item-level tags. The barrier to deployment drops sharply in that case, per Fdatabot. A store that needs to know exactly which items are present should lean on tag reads. RFID also wins when products sit stacked, folded, or packed in cartons, because its non-line-of-sight reading stays reliable where a camera cannot see.
The scenario table from Fdatabot makes the pattern concrete:
Typical Scenario | Usually a Better Fit | Why |
|---|---|---|
Apparel and footwear | RFID or hybrid | Many SKUs, size and color variants, overlapping products, valuable item-level identification |
Warehouses or backrooms already using RFID extensively | RFID | Leverages existing tags for more frequent automated counts |
General merchandise, pharmacies, electronics | Vision or hybrid | Depends on existing RFID and the need for both inventory and shelf data |
When rfid is the better fit, the deciding signals are tagged stock, high volume, and a fast-count need. A handheld sweep confirms identity in seconds, and the event stream supports inventory tracking across receiving, backroom, and floor.
When to Choose Computer Vision
Computer vision is the better fit when the store needs shelf context rather than item identity. Fdatabot draws the line clearly: RFID answers "exactly which items are here," while vision answers "is the shelf out of stock, are items misplaced, or is the price label wrong?" A retailer focused on out-of-stocks, low stock, misplacements, and merchandising conditions should choose vision.
Supermarkets and grocery retail land here, per Fdatabot, because shelf and merchandising conditions drive the business. The same logic covers fresh and untagged categories, where no practical tag point exists. When computer vision is the better fit, the signals are untagged goods, visual shelf goals, and a need for richer context. One scan can support pricing, planogram compliance, replenishment, and store execution at once.
When to Choose Both
A hybrid system fits when both data streams pay off. Fdatabot notes that the two data types complement each other and can tell the difference between "the product is in the store" and "the product is correctly stocked on the shelf." That distinction matters for general merchandise, pharmacies, and electronics, where the answer depends on existing RFID coverage and the need for both inventory and shelf data.
The criteria table from Fdatabot summarizes the full decision:
Criterion | Points toward |
|---|---|
Products already tagged with item-level RFID | RFID |
Need to know exactly which items are here | RFID |
Need to know shelf status, misplacements, or price label errors | Vision |
Products frequently covered, stacked, folded, or packed in cartons | RFID |
Each scan must also support pricing, planogram compliance, replenishment, and store execution | Vision |
Fdatabot sums up the principle well: RFID is better at understanding item identity, and vision is better at understanding shelf condition. A store that needs both answers should run both systems and reconcile the data. The framework stays objective. Each technology fits a defined job, and the right choice follows from the store's own answers.
No single technology works for every store. The best choice depends on what the store sells, its layout, and its inventory goals. RFID works well for counting tagged items in large numbers. Computer vision works well for untagged goods and for checking how shelves look. A hybrid approach fits when both kinds of data help.
A small pilot focused on one task settles the question with real numbers. Choose one task you can measure, set targets for accuracy and labor hours, and compare results side by side. Total cost of ownership breaks any tie.
These two technologies increasingly work together instead of competing. Tags confirm identity, cameras confirm shelf condition, and together they give retailers a fuller picture of inventory than either system delivers alone.
FAQ
Does RFID cost more than computer vision upfront?
Often, yes. A tag-based rollout pays for labels, readers, antennas, and encoding equipment on top of software. Cameras cover a whole aisle with one device. PatSnap reports that RFID carries higher initial costs but lower operating costs through less labor and fewer mistakes. Buyers should compare both columns over a full multi-year period.
Which option delivers higher inventory accuracy?
Both can do well, and the answer depends on conditions. Auburn University RFID Lab research shows retailers using RFID often reach 95 percent or better accuracy. SupplyChainBrain reports vision-based cycle counting often exceeds 98 to 99 percent. Neither figure promises results in a specific store. Tag reliability and model quality decide the real outcome.
Can computer vision handle products without tags?
Yes. Vision models recognize packaging, facings, and empty slots without any per-item chip. This makes the approach practical for fresh produce, bakery goods, and deli items, where no sensible tag point exists. Accuracy depends on lighting, occlusion, and how distinct the products look from one another.
Do retailers need both systems?
Some do. Industry experts note that retailers may need barcode, RFID, and vision systems together to meet business goals. Tags confirm which item is present. Cameras confirm how that item sits on the shelf. A hybrid setup fits stores that already run both infrastructures and can match the two data streams.
How long should a pilot run?
HudaSoft suggests testing the highest-ROI use case in two or three stores for 90 days. That window gives the team a clean baseline and enough data to compare results. A narrow scope keeps risk small. A failed pilot costs far less than a failed chain-wide rollout.
What hidden costs should buyers budget for?
Tagging labor is the largest. Cloudpick estimates a mid-sized operation processing 50,000 items daily needs 8 full-time equivalents for tagging, totaling $1.8 million over five years at $45,000 per employee. Vision systems avoid that team but add integration, model training, and change management. Both paths need staff training.
Will one technology eventually replace the other?
The evidence points the other way. Tags confirm identity, and cameras confirm shelf condition. Each answers a different question. Retailers increasingly pair the two streams to get a fuller picture of inventory. The choice therefore comes down to fit with product mix, store format, and goals, not to picking a single long-term winner.
See Also
Smart Electronic Vending Machines Are Transforming Retail Through Advanced Technology
Micromarkets Versus Smart Stores: Automated Convenience Retail Operations Globally Explained
Vending Machines Represent the Future of Automated Fast Food Service
Examining Walgreens Self-Checkout: Retail Convenience and Challenges Explored
Boosting Employee Productivity Using Smart Vending Solutions in Small Offices
