How AI Analytics Optimize Airport Passenger Flow During Peak Times

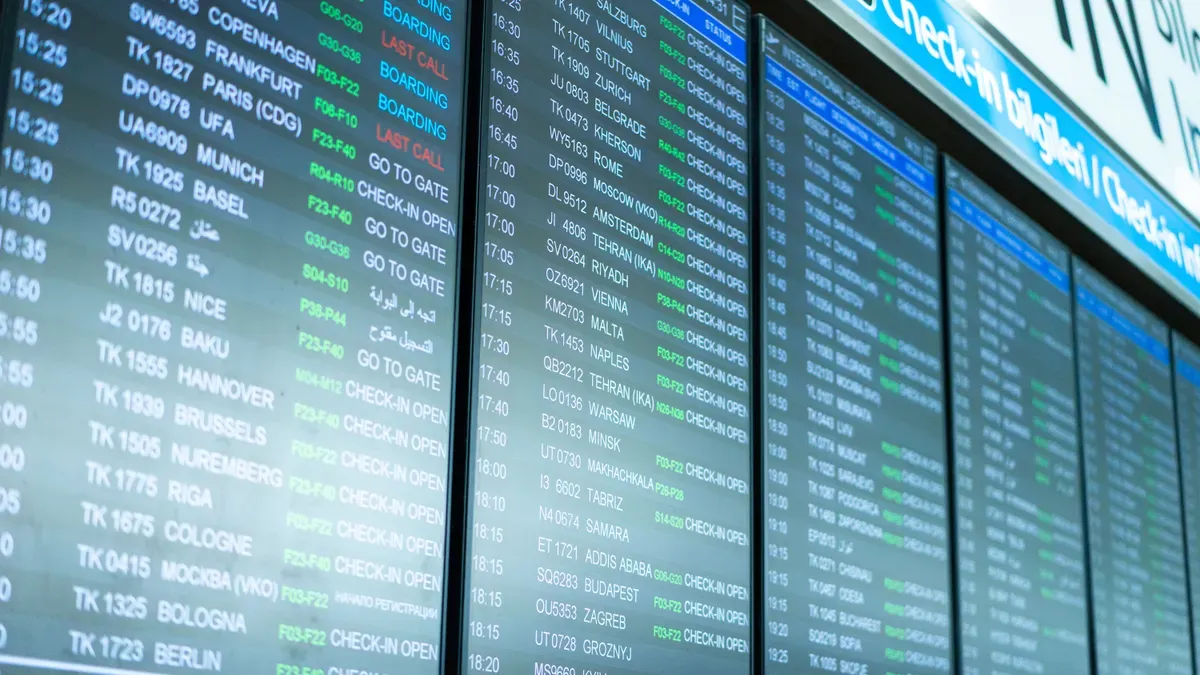
At 6 a.m. on a holiday Monday, the security line winds past the duty-free shops, agents call out boarding times, and passengers sprint toward gates they will never reach.
According to the arXiv paper, long airport security lines caused one in seven travelers—about 14.3%—to miss a flight in the past 12 months.
Airports cannot build new terminals overnight, so they must use existing space and staff more intelligently. AI analytics, combining computer vision and predictive modeling, delivers a practical answer with real-time queue measurement, bottleneck prediction, digital twin simulation, and automated alerts. These tools make handling peak passenger flow with AI retail – scenario [Commercial] possible. For operations managers, implementation, privacy, and ROI planning remain essential considerations.
Key Takeaways
AI analytics use cameras that are already in place to measure how long the lines are and how long people wait, in real time.
Predictive models predict bottlenecks 30–60 minutes ahead, so staff can act early.
Digital twin simulation tests staffing and layout changes without interrupting actual operations.
Automatic alerts and moving staff to where they are needed cut down on wait times and missed connections.
A step-by-step rollout that follows privacy rules gives strong returns and a better experience for passengers.
Why Peak Flow Breaks Traditional Management
The Cost of Reactive Queue Control
Fixed staff schedules follow the flight timetable, not the passengers. A holiday departure bank can push hundreds of travelers toward one security checkpoint in just minutes. The checkpoint has a set number of lanes and a set number of officers. The queue grows faster than the lane can handle.
Reactive control means someone spots the problem after it starts. A supervisor walks the floor, sees the crowd, and calls for backup. That call takes time. Officers must leave other posts, walk to the checkpoint, and set up equipment. By then, the queue has already swallowed the walkway.
The operational cost adds up fast. Passengers leave the line, miss connections, and need rebooking. The arXiv data cited earlier shows one in seven travelers missed a flight because of long security lines in the past year. Each missed connection means gate agent time, baggage rehandling, and compensation claims. One overwhelmed checkpoint can spread into a terminal-wide disruption.
Why Manual Counting Falls Short
Manual counting gives you a snapshot, not a stream. An agent with a clicker records how many people pass a point. That number comes late and covers only one location. It cannot show how fast the queue is growing or where the pressure will move next.
Surge volumes show the gap. A departure bank releases passengers in waves, and each wave hits different checkpoints at different times. Manual methods cannot track multiple queues at once. They also cannot tell a slow-moving line from a stopped one.
A count taken five minutes ago describes the past. Peak flow demands a measurement of the present and a forecast of the next hour.
Static schedules and clipboards cannot close that gap. Airports need continuous, automated measurement to see surges as they build.
Real-Time Computer Vision Measurement
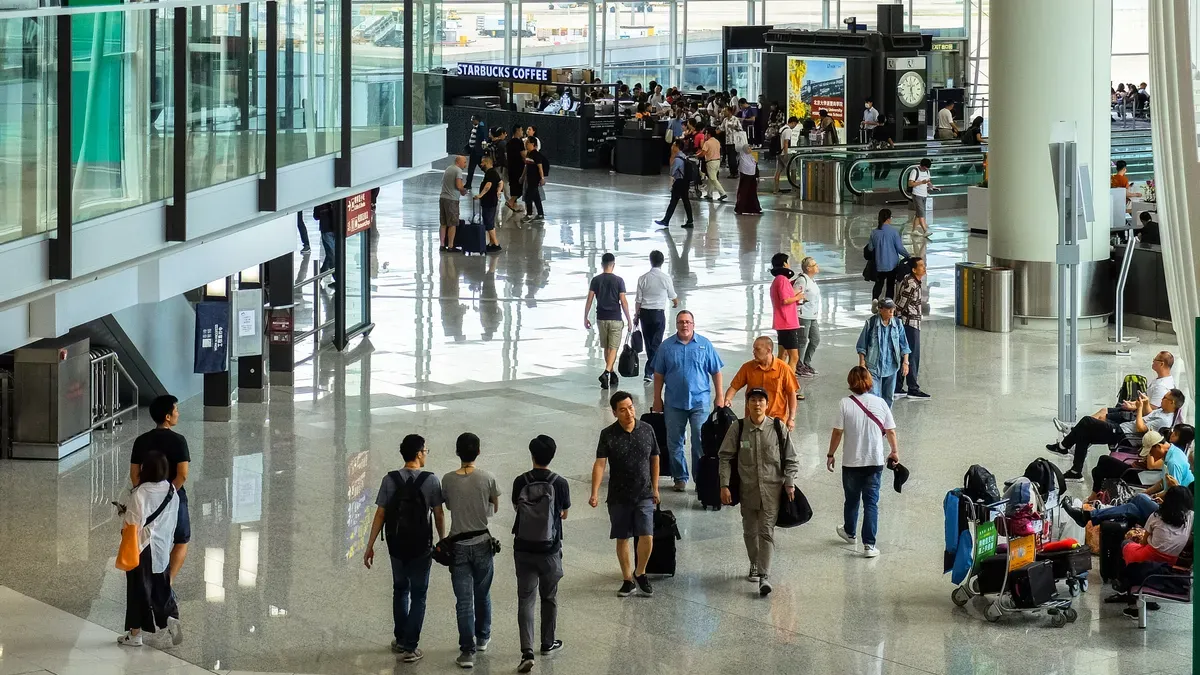
A camera that only records video does not take action. With AI analytics, it turns into a working sensor. It counts people, checks speed, and flags crowd problems before they become gridlock. Normal security cameras become live-flow tools with no new hardware.
From CCTV to Live Flow Metrics
Computer vision uses the airport's existing CCTV network. Each feed becomes a counting zone with analytics software. Overhead cameras with 3D analytics see the whole queue area. Edge processors filter the stream in real time and send structured events to the control room. The video management system stores full clips.
Add video analytics software to current CCTV feeds so cameras act as operational sensors.
Apply object tracking to count travelers and follow them through checkpoints.
Use overhead crowd-density mapping to find congested zones.
Let AI models estimate wait times from walking speed and density, and update as conditions change.
Process at edge and server: edge analytics filters streams and sends structured events to control rooms while VMS stores full clips.
Send structured events through MQTT to dashboards, BI tools, and airport systems for live metrics and actions like opening lanes.
The model drives detection accuracy. Transfer learning with a multi-view convolutional neural network (MVCNN) hit 99.1% test-set accuracy on a passenger screening dataset. It hit 100% accuracy on its development set. Earlier studies show MVCNN matches or beats 3D CNN performance, especially when training data is limited. Deep-learning systems handle complex scenes, adapt to changing conditions, and return more accurate, actionable insights than traditional machine vision.
Aeroparque airport in Argentina shows this pattern. It measured check-in, security, and immigration live with only existing CCTV. No new cameras were installed. Its daily flow averaged 52,000 passengers, with a record peak of 59,000. APIs linked flight systems, resource allocation, BI dashboards, messaging, and reports. Local edge processing used anonymous metadata rather than stored images. Airport queue-management projects that use AI video analytics on existing CCTV have cut average wait times by up to 30%.
Measuring Wait Times and Density
With live metrics, raw video becomes operational data. The system measures queue length, service time, passenger density, movement speed, direction, and occupancy. It covers terminals, gates, and security areas and makes heatmaps and crowd-density maps.
The table below lists the main metrics and how they are measured.
Metric | How It Is Measured |
|---|---|
People in line | Counted inside a defined waiting area; the most reliable raw data and least open to interpretation |
Throughput at open stations | Passengers served per minute per station, showing real system capacity |
Estimated wait time | Line length divided by observed throughput; more reliable than tracking individuals and needs no individual tracking |
Waiting area occupancy rate | Shows comfort level and how much room remains before the line spills into traffic lanes |
The wait-time estimate is line length divided by observed throughput. It needs no individual tracking and protects privacy. Occupancy rate shows when a zone nears overflow. Density maps show where passengers gather and where walking speed slows. Direction tracking shows flow into gates, shops, and security lanes.
These measurements show the present in real time. They give operations teams one common view of the terminal. That shared view is the basis for prediction, simulation, and automated response.
Predicting Bottlenecks 30–60 Minutes Ahead
Forecasting turns live measurement into a plan. AI models look at what is happening now. They compare it to past events. Then they predict wait times 30–60 minutes ahead. Operations teams get the forecast before the crowd builds up. They can act while there is still time. This early warning is what makes prediction different from reacting.
Combining Schedules, History, and Live Data
A prediction model needs three kinds of input. Flight schedules tell when demand will come. Historical patterns show how similar days went. Live passenger data shows what is happening right now. Booking trends complete the picture. They show when ticket sales will turn into real crowds at the terminal. Each layer adds a different piece. No single source is enough on its own.
The model uses these inputs for two main jobs. Delay prediction mixes past patterns, weather, and real-time data. This helps airports manage schedules ahead of time and talk to passengers. Passenger flow optimization combines check-in and boarding records, both past and present. It makes processes smoother, cuts wait times, and improves the travel experience.
A unified pipeline collects every source. Passenger flow sensors, flight schedule feeds, check-in records, gate activity logs, and equipment health streams all flow into one system. An event-driven approach handles live data from many sources. It puts out about five relevant flights per second, with 30 data points per flight. A constantly updated arrival prediction comes with a confidence range backed by both past data and live updates.
The modeling sequence follows five steps:
Gather multi-source data into a unified pipeline.
Train zone-specific demand models using past flow patterns, flight schedule features, and seasonal changes.
Run trained models on live operational data to produce congestion probability estimates for each terminal zone.
Set thresholds that trigger gate swaps, staff redeployment alerts, and maintenance work orders.
Feed zone-level forecasts into the Airport Operations Center decision layer for real-time intervention sequencing.
Early Warning for Security and Boarding
Early warning systems watch the whole terminal. Computer vision tracks queue lengths at security checkpoints, check-in counters, and immigration. AI models predict wait times using queue depth, processing rates, and incoming passenger flows from arriving flights or transport connections.
Alerts trigger real actions:
Opening more lanes when queues pass set limits
Sending mobile notifications that send passengers to less crowded checkpoints
Changing staffing levels on the fly
The system also learns repeating patterns. It spots Tuesday morning business travel surges and weekend leisure peaks. It moves resources into place before those waves hit. Dynamic passenger flow models update every few minutes. They follow crowd movement from curb to gate. Odd congestion, unexpected routing, or new bottlenecks trigger alerts with suggested actions.
Flight information integration allows predictive management. A wide-body international flight landing with 400 connecting passengers starts a chain of predictions. Security queues, gate congestion, and customs processing all get projected impacts before passengers reach those areas. Gate agents can change boarding calls, and security managers can move officers to the affected checkpoint.
Security coverage goes beyond queues. Crowd monitoring flags unusual gatherings and sudden movements. Abandoned baggage detection scans feeds for unattended items. Weapon detection systems spot visible or hidden weapons. An integrated threat assessment combines CCTV, access control, and behavioral analytics. Every layer gives security teams early warnings without slowing passenger flow. These models support human judgment rather than replace it.
Digital Twin Simulation for Peak Scenarios
Testing Staffing and Layout Changes
A digital twin is a computer copy of terminal operations. It copies check-in, security, and boarding in software. Planners can try a new lane layout or a staffing plan inside this copy. No passenger feels the change until the plan works well.
A digital twin for airport terminal passenger flow operations is a virtual model of the airport that stays connected to real-time data from sensors, flight feeds, ground systems, and passenger-flow analytics. It is used to predict likely upcoming conditions before they can be seen, such as spotting a growing security bottleneck about 20 minutes before it shows up on the terminal floor.
The twin connects to live data feeds and runs all the time. Teams replay bad weather or security events and watch how terminal performance changes. This testing causes no risk to real operations. Simio digital twin deployments report 12–18% better use of staff and equipment. CAST Terminal cases show congestion drops near 20% and processing speed gains near 10%. Digital twin implementation has also been tied to a 35% drop in implementation risks.
Simulating Holiday Surges and Irregular Ops
Holiday departure banks create pressure that can be predicted. The twin simulates those waves before they arrive. Planners compare staffing choices and lane openings across many scenarios. They test ideas with short runs and measure differences with longer repeats.
Irregular operations need the same approach. A cancellation sends hundreds of passengers back into the terminal. The twin models that surge and shows where lines will form. Real deployments prove the value.
Airport / System | Digital twin simulation use for passenger-flow operations | Reported outcome |
|---|---|---|
Dallas Fort Worth (DFW) | Live tracking of ground-support, fuelling, catering, and baggage assets during aircraft turns | Aircraft turnaround reduced by 5–12 minutes per rotation |
Vancouver International | Simulating gate expansions, check-in layouts, and escalator relocations against passenger-flow patterns | Potential bottlenecks identified before construction and capital investment |
Singapore Changi | Simulating Skytrain scheduling scenarios and monitoring real-time occupancy | Passenger movement optimised and wait times reduced across airside and landside networks |
Handling Peak Passenger Flow with AI
Automated Alerts and Staff Redeployment
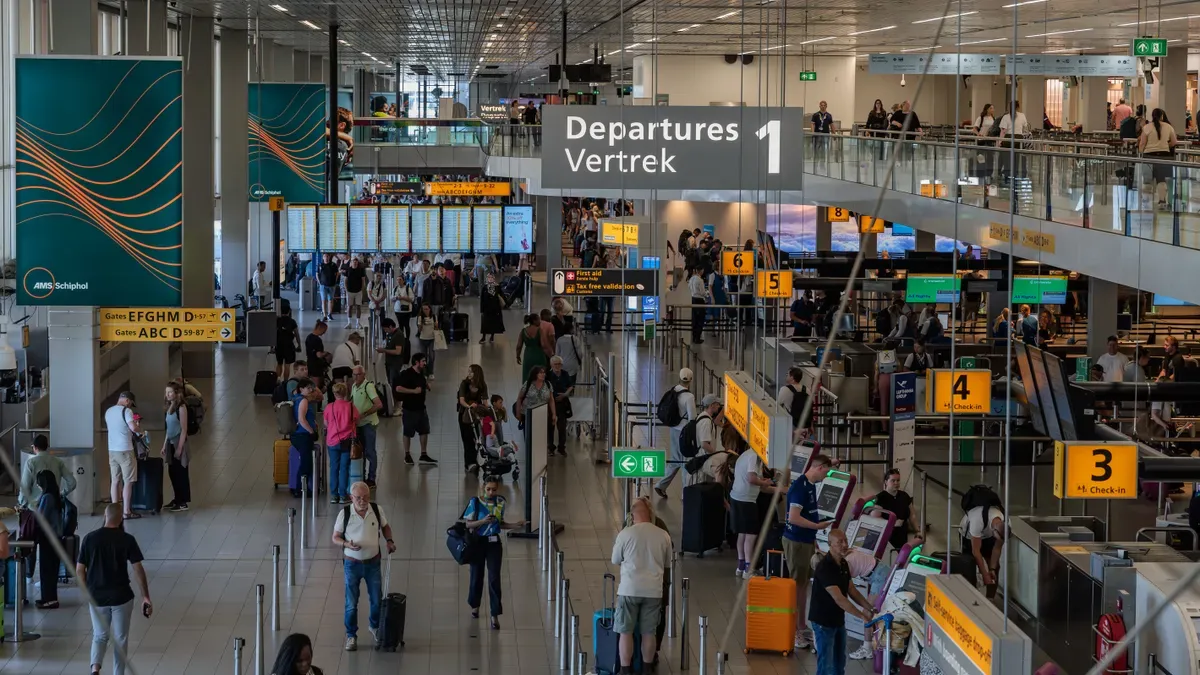
Measuring and predicting are useless unless they cause action. Alerts link analytics to operations. The system watches every zone's capacity limits. If a line goes past its limit, an alert fires into the Airport Operations Database and Flight Information Display Systems. Resource management and concession systems get the same alert. APIs and connectors let the space management platform act as an operations hub. It swaps data in real time with airline operations, security teams, and retail partners.
Clear roles and a chain of command show who responds. Checklists and playbooks across teams guide busy times. Regular training and after-incident reviews make one-off fixes into repeatable steps.
Moving staff follows the same logic. Computer-vision monitoring checks line length, crowding, and how long people stay at security checkpoints. Staffing prediction models mix past flow data with live video. They forecast peak demand and suggest specific staffing levels. Dashboards send these events to operations systems, so operators see where staff are needed most. AI security models have been linked to about a 20% reduction in screening times in certain deployments. Platforms such as Beonic help optimize staffing at immigration, baggage claim, and security. Adelaide Airport uses this technology for live operations decisions. A North American international airport shows real-time line density and wait times at TSA checkpoints using anonymized spatial analytics.
Rerouting Passengers and Dynamic Lane Opening
After an alert, the system suggests changes to operations. It can open more security lanes, move staff around, and point passengers to less crowded areas. AI-powered flow management uses CCTV analytics, computer vision, IoT sensors, past passenger data, live flight schedules, and mobile tracking.
Research on AI-driven airport traffic management shows how rerouting works. Deep Reinforcement Learning agents constantly study traffic conditions. Adaptive reward mechanisms adjust traffic prioritization based on congestion levels and pedestrian density. Upstream anti-bottlenecking techniques adjust intersection control on the spot. The system gives priority to alternative routes and favors pedestrian phases when it detects clusters. This keeps critical terminal areas safe and easy to navigate.
Personal guidance takes the response further. Mobile alerts can guide individual passengers to quieter checkpoints. Service robots can guide travelers through crowded areas. These actions help handle peak passenger flow with AI retail – scenario [Commercial] outcomes by balancing terminal occupancy and protecting retail revenue.
AI Retail – Scenario [Commercial
Balancing Terminal Occupancy During Surges
AI analytics links how passengers move to business results. Real-time queue tracking watches line length, wait time, how many people pass each checkpoint, and how crowded all processing areas are. Color-coded alerts show when limits are crossed. This clear view helps with staffing and lane changes during busy times.
Retail intelligence goes a step further. Airports can place gates on purpose to bring more likely shoppers into food, drink, and store areas. Reviews of each flight's performance then improve product placement and deals. Crowd-control plans mix retail footfall data with passenger movement. This balance eases packed zones while keeping stores reachable without blocking walkways.
"It's the holy grail of commercial activity in an airport," said Paul Staples, Operations Director at Liverpool John Lennon Airport. "It gives us accurate information that allows us to plan more effectively at an operational level, while also helping to inform decision-making for marketing and spend per head in retail and concession environments."
LIDAR, camera, and IoT sensor networks map crowding in real time. This gives correct estimates even in packed or blocked areas. Retail zones can stay open or adjust based on exact demand instead of closing everything. Forecasts based on dwell time, passenger profiles, and buying trends guide terminal layout, staffing, and restocking plans. This matches products and inventory with real demand, supporting steady revenue without pushy selling.
Personalized Passenger Guidance and Revenue Impact
Personalized guidance turns flow management into revenue protection. Passengers with high satisfaction spend up to 45% more on retail and dining. A 10-minute cut in security queue time can raise per-passenger retail spend by as much as 15%. For a hub handling 20 million passengers a year, satisfaction gains can mean tens of millions in extra revenue.
Smart robot ecosystems create retail revenue through personalized ads, premium help services, and better passenger throughput. The Passenger Guidance and Information robot segment reached USD 0.40 billion in 2025, representing 28% of the market with a 15.4% CAGR. Hospitality and Retail Assistance robots reached USD 0.18 billion, a 13% share with a 17.9% CAGR.
"Airports can't improve what they can't see," said Enzo Signore, CEO of Quanergy Solutions Inc. "From checkpoint performance to retail uplift, Q-INSIGHTS helps airports transform live movement into measurable outcomes."
Handling peak passenger flow with AI retail – scenario [Commercial] outcomes depend on this integration. Virtual queuing and trip planning support from parking to gate keep passengers moving. This preserves dwell time for retail activity while reducing operating costs through aligned lighting, HVAC performance, and asset usage.
Before and After: Measurable Benefits
Reduced Wait Times and Fewer Missed Connections
The change from reacting to problems to predicting them shows up in clear numbers. The table below compares normal results before and after AI analytics are used.
Metric | Without AI Analytics | With AI Analytics |
|---|---|---|
Queue warning lead time | None (found only when the queue forms) | 30–60 min ahead (alert before the limit is passed) |
Staff deployment | Reactive — extra staff called after the queue is long | Preemptive — staff moved 20+ min before demand peaks |
Peak-hour wait exceedances | Baseline | 40% fewer |
Queue-caused missed connections | 47+ empty seats per cascade event, $186K+ airline claims | 85% reduction via at-risk passenger ID + priority lane routing |
Passenger satisfaction | Complaints handled after the fact (ASQ impact) | 92% satisfaction in AI-managed zones |
ASQ score improvement | Baseline | 15–25% improvement within 12 months |
Effective throughput | Baseline infrastructure | 20–35% more throughput from existing infrastructure |
The throughput gain matters most for capacity planning. Airports move 20–35% more passengers through the same physical space. Peak-hour wait exceedances drop by 40%. Finding at-risk passengers and routing them to priority lanes cuts queue-caused missed connections by 85%. Passenger satisfaction in AI-managed zones reaches 92%, and ASQ scores improve 15–25% within 12 months.
Cost Savings and Staff Efficiency Gains
Labor is a major cost center for large hubs. A hub with $500M in yearly operating costs and a 30% personnel share carries about $150M in labor costs. A careful plan cuts addressable labor by 5–10%, saving $7.5M–$15M per year, or 1.5–3.0% of total Opex, over 5–10 years. Moderate adoption reaches 10–15% labor reduction and $15M–$22.5M in yearly savings. Aggressive adoption reaches 15–25% and $22.5M–$37.5M.
Real savings often come in below early estimates. Major U.S. airports have recorded gaps between business case projections and actual results. Baggage automation at large hubs may reach 50–70% of projected labor reductions. Customer service automation may reach 40–60% of projected staffing cuts. Maintenance costs, exception handling, and labor limits explain the gap. Planners should model careful returns and treat upside as a bonus.
Implementing AI Without Disrupting Operations
Phased Deployment and CCTV Integration
Airports seldom replace systems overnight. The best plan has five steps: share data, add predictive tools, use AI insights to adapt work, add automation slowly, and let technology, people, and processes grow together. Training for each role helps staff trust and use AI tools. Security teams learn to read flow forecasts and move resources before backups form.
Connecting existing CCTV keeps costs low. Live camera feeds plug straight into AI software, so no new hardware is needed. The software watches queues, predicts crowding, and handles terminal flow. Automatic gate optimization, equipment schedules, and baggage slot changes run in real time. It can spot security checkpoint backups about 20 minutes before they form. That gives virtual terminal expansion: about 35% better use of space with no construction.
In a project with Amsterdam Airport Schiphol, the airport's biggest technology and strategy change had many parts. It required handling technology dependencies, building governance, and creating a project list to rank priorities. Airports add AI in stages by working with the airport community, not by swapping old systems overnight.
Frontline staff need the authority to act on AI advice. Daily AI workflows turn alerts into action. Staff move to more crowded checkpoints and open lanes before queues take over. Handling peak passenger flow with AI retail – scenario [Commercial] depends on this readiness.
Privacy Compliance and ROI Planning
Privacy strengthens the business case. ICAO Annex 17 standards set security rules. GDPR and CCPA control personal data. Biometric data regulations apply when identity checks happen. EASA AI ethics guidelines demand transparency, accountability, human oversight, and contestability. A strong framework covers data retention periods, clear access controls, regular audits, bias checks, and fixes.
ROI planning follows a clear sequence. First, set an operational baseline by measuring current reactive costs. Then compare six value areas against that baseline: avoiding unplanned downtime, saving maintenance labor, lowering regulatory compliance costs, cutting parts inventory, managing energy costs, and deferring capital work. Next, model setup costs and produce board-ready projections. Strong programs show a 312% average three-year ROI, an 11-month median payback, and $2.8 million average first-year savings per 100 monitored assets. A phased approach makes these numbers realistic, not just hopes.
Peak-time crowding is a problem airports can fix, not just a cost of growth. Three main parts make this work: live computer vision measurement, predictive analytics, and automated operational response. Together, they turn today's terminals into smarter, more responsive spaces.
Airports can add these tools in stages, protect privacy, and connect them to CCTV systems they already have. Airports that bring in AI analytics now will set the passenger experience standard for the next ten years. Handling peak passenger flow with AI retail – scenario [Commercial] outcomes will come along on their own.
FAQ
Airport leaders ask practical questions before setup, and the answers come from data at working airports and public standards.
How does the system estimate wait times without tracking individual passengers?
Wait time is line length divided by throughput, and live camera zones give the counts. The formula doesn't track people, so privacy stays safe and updates come every few minutes.
How far ahead can the model predict congestion?
The model predicts a surge 30–60 minutes ahead by mixing flight schedules, past patterns, and live passenger data. Alerts go out before a line gets too long, so staff can move and lanes can open now.
Does the system require new cameras?
No, the software uses CCTV networks already in place. Aeroparque airport in Argentina used no new cameras and handled 52,000 passengers a day. Existing CCTV systems have cut average wait times by up to 30%.
How does the airport protect passenger data?
At the edge, systems read anonymous metadata instead of storing images. The design follows ICAO Annex 17, GDPR, CCPA, and EASA AI ethics guidelines. Data retention, access controls, and audits complete the governance.
What return can an airport expect from AI flow analytics?
Strong programs show a 312% average three-year ROI, and median payback is 11 months. First-year savings average $2.8 million per 100 assets. These gains help handle peak passenger flow with AI retail – scenario [Commercial] outcomes. Realistic models treat those figures as targets, not guarantees.
See Also
Smart AI Combo Vending Machines Showcase Modern Retail Advantages
AI E-Commerce Tools Revolutionize Digital Store Management Processes
Cloudpick's Checkout Computers Boost Efficiency, Accessibility, And Customer Experience
Smart Vending Solutions Boost Employee Productivity In Small Offices